Last time I left you with a cliff hanger. Why is my simple virtualized scrolling list going blank if you scroll it too fast? I had some theories. Time to apply the scientific method and see which ones stand up.
Search Query Engineering
While all the cool kids have moved on to ChatGPT prompt engineering, I start most of my research with Google search query engineering. Can I find the right form of words that will make Google give me something useful?
Chrome Breakpoints
I started with the weird breakpoint behavior in Chrome. Have I really found evidence that there’s an inherent race condition between the main and rendering threads when scrolling triggers a DOM update?
I struck pay dirt with “why chromes rendering result is different when using breakpoints”. I found an answer on Stack Overflow. It says that the browser enters a special “spin the event loop” mode when it hits a breakpoint. In this mode the event loop continues background processes such as CSS animations and repaints of DOM changes, while disabling execution of event handlers.
Which explains the weird behavior I was seeing when debugging. No smoking gun there.
Chrome Rendering Tab
The next query I tried was “chrome updated dom during scroll but didn't render”, which generated a lot of useful looking results. I learnt that Chrome developer tools has a rendering tab which includes a checkbox to identify “Scrolling Performance issues”. Unfortunately, nothing in the rendering tab shed light on my scrolling problem.
Chrome Rendering and Compositing
A link from that article took me to a Chrome blog with useful background information on the renderer process and how input is handled by the compositor process. That article makes it clear that there is no race condition. If the element being scrolled has an event listener, then fast scrolling is disabled and the rendering process waits for the event listener to run first. That is, unless you mark your event listener with the passive: true property.
No, that’s not it. The Scroll event listener in my app doesn’t have that property set.
The will-change CSS Attribute
The render process article introduced me to the will-change CSS attribute. It’s used as a hint to the browser that you’re going to change something. The browser can use the hint to decide how to divide the page into compositing layers. This can help avoid “flicker” and “jank”. Maybe that’s what I’m suffering from?
I tried adding a few variations of will-change attributes to my app’s style sheet but it didn’t make any difference.
Chrome Layers Tab
The Chrome rendering article mentions the Chrome developer tools Layers tab. This tool lets you see how the browser has divided your content into compositing layers.
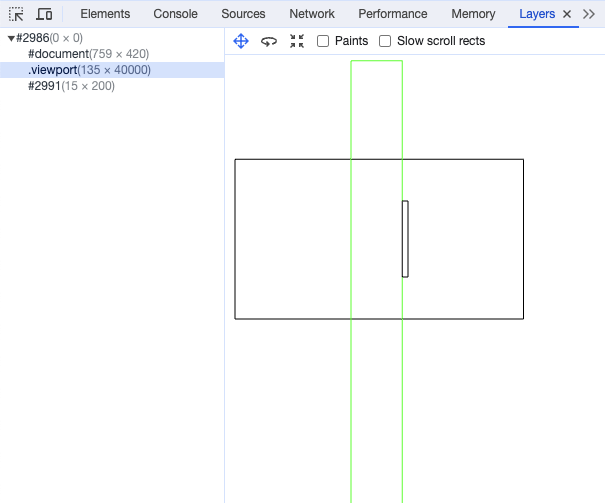
There are three layers. The large black rectangle (#document) represents the visible page. This is the default layer containing everything that isn’t on another layer. The long green rectangle (.viewport) is the child container that the viewport is scrolling over. The layers tab shows it moving up and down as you scroll. The final rectangle (#2991) is the scroll bar that the browser creates.
Now it gets interesting. When I scroll up and down quickly so that the scroll list goes blank, the viewport layer disappears (both visually and from the list on the left). Something is happening to make the browser think that a separate layer isn’t needed.
I then noticed that the DOM structure didn’t actually have a distinct child container. The viewport container has a direct list of children: the top padding containers and all the loaded rows. Maybe when React is rebuilding the DOM when you’re scrolling fast, it ends up throwing all the existing elements away and making new ones. There’s nothing stable for the browser to map to the layer.
I added another div between the viewport and the children. Hopefully React would reuse it rather than replacing it when rebuilding the DOM. It worked, to some extent. The viewport layer no longer disappears from the layers tab, but the scroll list still goes blank.
The layers tab can also show what is being painted on each layer by checking the “Paints” checkbox. I frequently get graphical glitches on my Macbook Air when I try this. The entire viewport rectangle goes black. When it does work, it’s magical. I can see all the items rendered (including those outside the viewport). The display updates in real time as I scroll. Unfortunately, if I zoom in far enough to see the detail of the text being rendered, the graphical glitches kick in.
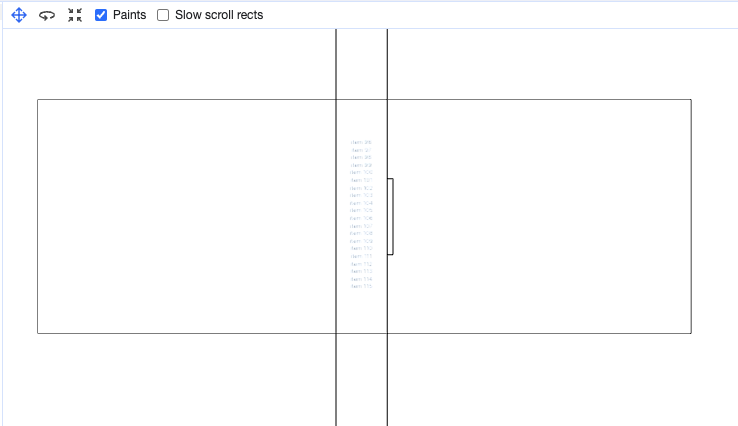
Interestingly, the text in the layers tab never goes blank as I scroll. I can also see that the text is always correctly positioned. At first I thought this must mean that the browser is not compositing that layer into the final render. However, as I scroll around, I sometimes see a state where the previously out of view rows in the DOM are scrolled into view and visible with the rest of the control blank. I think this is more likely to be an artifact of the developer tools, like the breakpoints behavior.
React Developer Tools
I went back to the Chrome input processing blog. Something weird is going on when there’s lots of scroll input. The article mentions that input events are coalesced and delivered at the same rate as requestAnimationFrame. The assumption is that you will receive the latest events, update state, render and commit before the browser repaints the window. Is it possible that the whole process is taking too long and that somehow the browser is repainting before the commit?
The React team have a Chrome extension that adds some React specific tools, including a profiler, to the Chrome developer tools. Time to try that out.
The profiler shows each commit on a timeline, capturing information about which components were re-rendered and how long that took. I recorded a profile while scrolling furiously up and down. The profiler captures data about each React component. In my case, there’s only one, the scroller.
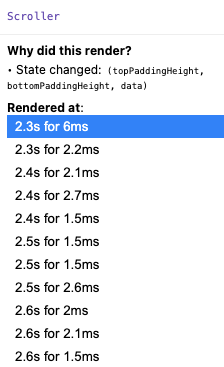
The component is being rendered 3 times in every 0.1 seconds, or 30 times a second. The Chrome developer tools render tab confirms that animation is running at 30 fps. That gives a budget of 33ms per frame. After the initial render, each re-render took just 2-3ms, in a development build. Doesn’t seem like there’s any performance problem.
Screen Recording
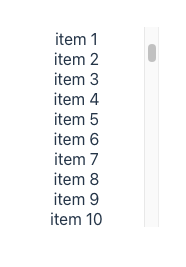
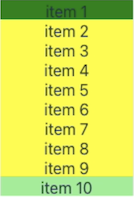
Time to slow everything down and see what’s really going on. I used the screen recording feature on the Mac to record what was happening in the control when I did a single click below the handle to scroll down a page. I hacked the app’s style sheet to add some color coding. Items have a yellow background by default. The first virtualized row that should be visible is dark green, the last one is light green. The control also creates five buffer rows before and after the ten main rows. If everything works as expected, the first item in each frame should always be dark green.
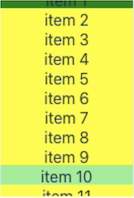
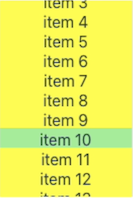
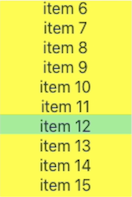
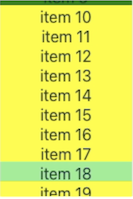
Well that’s not right. Two of the intermediate frames have content that has been scrolled up so that lots of buffer items are visible.
I went back to the React profiler data and my console logging. Correlating everything together, it looks like the bad intermediate frames were painted using the content created for the previous frame. If you scroll harder, the content scrolls up so far that none of the items are visible. Which would confirm my initial theory that the browser paint sometimes happens before the DOM is updated.
Chrome Performance Tool
The Chrome developer tools have a performance tab. I don’t know why I didn’t think to look at it before. It gives you a timeline that includes input events, all the significant stages of the rendering pipeline and JavaScript function execution. It shows you frame boundaries and even captures a snapshot of each rendered frame.
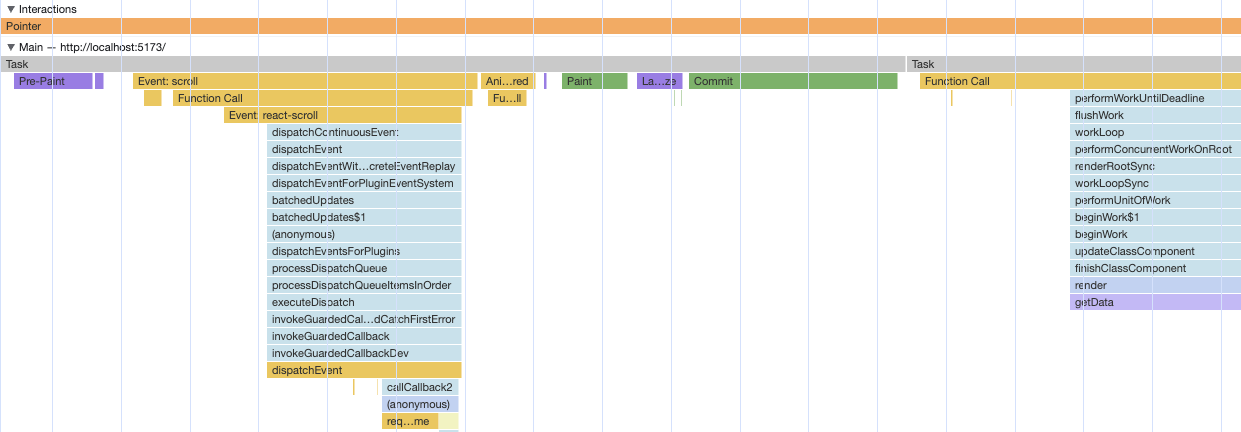
Finally, a smoking gun. Here I am, zoomed into the profile of one of the intermediate frames. The sequence of events is
- Pre-Paint: Browser is getting ready to paint but first needs to deliver coalesced input events and animation frame callbacks
- Scroll Event: Triggers a stack of React function invocations which eventually reach the control’s
OnScrollhandler which updates the React state - Animation Frame Callback: I added one that logs to the console
- Paint: Browser generates display lists based on the parts of the DOM that need repainting
- Layerize: Assign the display lists to layers
- Commit: Send the display lists off to the rendering threads
- Callback: Into React code that eventually calls the control’s
rendermethod
Rather than triggering a render synchronously when SetState is called, React schedules a callback to do the work. Which, unfortunately for me, is getting invoked after the browser repaints.
React Scheduler
Apparently, this behavior was introduced in React 16. Prior to that, React rendering always happened synchronously. Now, the scheduler module in React can break work up into smaller chunks to try and keep the UI more responsive. However, everything I’ve read suggests that this is opt in behavior that was first publicly exposed as Concurrent Rendering in React 18.
Why is my boring, minimal virtual scroll list control triggering this behavior? Do all React virtual scrolling controls have this problem?
React-virtualized and React-window
Going back to my original search results, I found some hits in issues for a GitHub project called react-virtualized. React-virtualized is a large library of React components that include virtual scrolling. There haven’t been any significant changes for years and the README suggests looking at react-window as a lighter weight alternative. React-window is similarly mature with minor bug fix activity and updates to support React 18.
A wider search found a recommendation for both in the React documentation on optimizing performance. So, clearly worth a look. React-window has an online sandbox that let’s you play around with the components. Go and try it now. Scroll up and down furiously. I’ll wait.
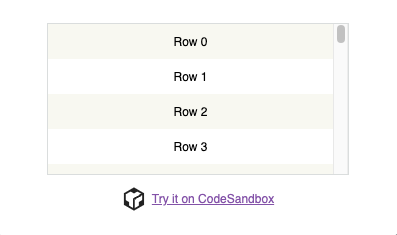
Absolutely solid. Completely responsive. No flashing or blank content. What are they doing that I’m not?
Next Time
If I was writing commercial software, I’d consider it case closed. Throw away my minimal virtual scrolling sample and switch to react-window. I may end up doing that, but first I want to understand why.
Prepare for a deep dive into react-window.