How can this be happening? I’m doing everything in my power to ensure that the visible content in my virtualized components is rendered before the browser paints. I’m using the legacy React render method which ensures that the DOM is updated immediately when an event is handled. I’ve restructured my spreadsheet component to ensure that everything is rendered before React returns to the event loop.
Despite all this, I still see flashes of blank content as I scroll, particularly when using the mouse wheel.
Smoking Gun
My first port of call was the Chrome performance tool. The tool can be configured to capture screen shots while profiling. I think I found a smoking gun.
I hacked my spreadsheet sample to include row numbers in both the header and the grid. The screenshots are tiny so I increased the font size massively. You can just about see what’s happening when I scale the screenshot up.
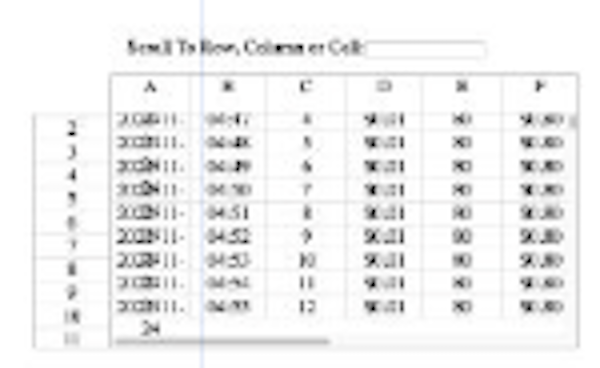
The row numbers are repeated in column C. You can see that the row header and the grid aren’t aligned. The header is showing rows 2-11 and the grid is showing rows 5-12 with a blank row at the end. Based on logs of the rows being rendered each frame, it looks like the browser is occasionally painting content rendered from the previous frame with the scroll offset from the current frame. Scroll far enough and the grid goes blank when the previous rendered content is scrolled out of view.
Reduced Scope
I had another look at the profile when rendering a single frame.
Everything happens in response to a single scroll event but I have two handlers for that event. The main one which implements virtual scrolling and a second one in a useIsScrolling hook which determines whether a scroll is in progress. I’m not using that feature in my spreadsheet, so I reduced the potential scope of the problem and removed the hook.
Makes no difference.
Forced DOM Update
My next thought was that maybe the React legacy mode rendering was broken. I’ve applied a few minor updates to React. It’s easy for bugs to creep into a rarely used legacy code path.
I switched to React 18 rendering. Which, as before, is even more broken. React 18 encourages the browser to paint before rendering for “continuous” events like scrolling.
I wrapped my handling of the scroll event with flushSync, which forces the DOM to update before returning. Which puts me back to the same behavior I see with legacy rendering.
Partially Presented Frame
I went back to playing around with the Chrome performance profiler. Trying different things out while recording a profile. The profiler has a track that shows how long each frame took to render. Usually each frame is shaded green but occasionally there’s a yellow one.
The tool tip tells me that this is a “Partially Presented Frame”. There seems to be a rough correlation between PPFs and glitchy renders. It’s not 1:1, but I don’t see any glitches at all in runs without a PPF and the more PPFs there are, the more glitches.
The Chrome Developer Documentation only has a brief mention of PPFs.
Partially presented frame (yellow with a sparse wide dash-line pattern). Chrome did its best to render at least some visual updates in time. For example, in case the work of the main thread of the renderer process (canvas animation) is late but the compositor thread (scrolling) is in time.
That sounds ominous. Is this a Chrome specific issue? I checked in Firefox and Safari. Firefox is absolutely fine - no glitches at all. Safari is the same as Chrome. At least I know the problem is browser specific.
GPU Accelerated Compositing
There’s more detail in the Chromium design document for GPU Accelerated Compositing,
In order to produce interesting new frames, the compositor thread needs to know how it should modify its state (e.g. updating layer transforms in response to an event like a scroll). Hence, some input events (like scrolls) are forwarded from the Browser process to the compositor first and from there to the Renderer main thread. With input and output under its control, the threaded compositor can guarantee visual responsiveness to user input.
Running the compositor in its own thread allows the compositor’s copy of the layer tree to update the layer transform hierarchy without involving the main thread, but the main thread eventually needs e.g. the scroll offset information as well (so JavaScript can know where the viewport scrolled to, for example).
Scroll events can’t be prevented and are asynchronously delivered to JavaScript; hence the compositor thread can begin scrolling immediately regardless of whether or not the main thread processes the scroll event immediately.
Layers
The DOM is divided into layers which can be painted independently and then composited together. Chrome has a tool that lets you see how many layers it’s using.
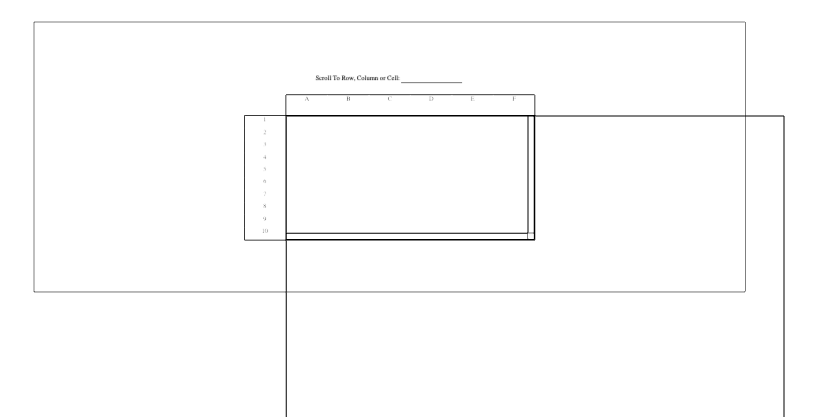
It’s a little sparse but you can see that the scrollable area of the grid is an independent layer.
Putting it all together
Now it makes sense. Scroll events are handled as a special case. They get delivered to the compositor thread first. The compositor moves the layer that’s being scrolled and gets ready to compose the final frame. It forwards the event to the main thread and waits.
Over on the main thread, the event is dispatched to JavaScript by the event loop. React does its thing, the visible content is rendered and the DOM updated. The browser repaints the scrollable area and tells the compositor that the corresponding layer needs updating.
The compositor decides that a frame is due. It combines all the layers and makes the result visible. If the main thread’s update completes before this happens, you get a normal frame and all is well. If the main thread didn’t report back in time, the compositor uses what it has and you get a partially presented frame with up to date scrolling of stale content.
Maximum Frame Time
Which suggests the problem is that frames take too long to render. How long is too long? The standard guidance is that apps should respond to page interactions (clicks or key presses) within 200ms, take at most 50ms when animating and ideally complete within 16ms.
How long do my updates take? The profile above is from a dev build and shows a scroll event that takes exactly 16ms to process from event delivery to browser paint. Production builds take at most 5ms per frame.
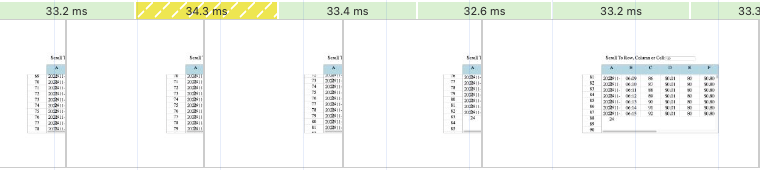
To make sure that rendering time isn’t the problem I turned my monitor refresh rate down to 30 Hz, giving 33ms a frame. Here’s a complete profile of a production build for one flick of the mouse wheel.
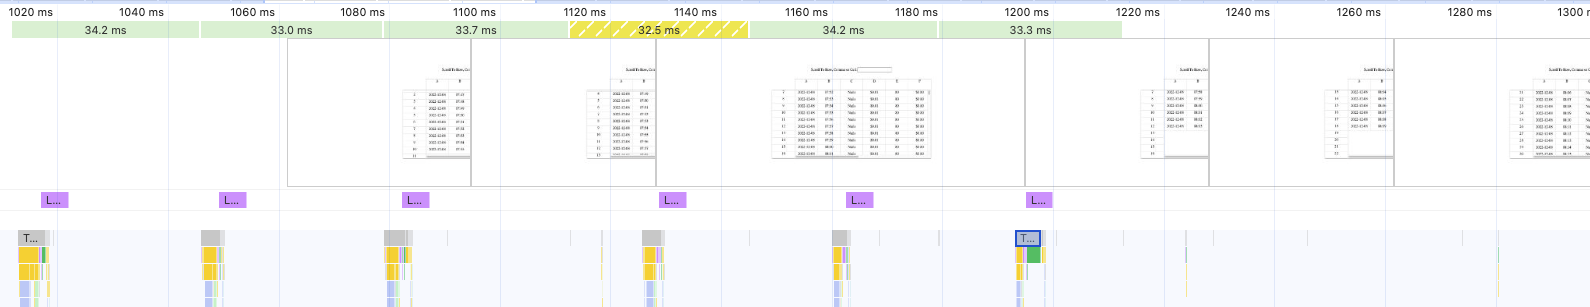
There are six scroll events with three good frames produced, then two bad ones before everything catches up for the final frame. There’s 28ms of idle time between each 5ms burst of rendering activity.
Good Frame
Let’s zoom into one of the good frames and look at the multi-track overview. The multi-colored track shows activity on the main thread. Orange is JavaScript execution, purple is rendering and green is painting. Below that is the raster thread that actually paints each layer, with the GPU compositor activity at the bottom.
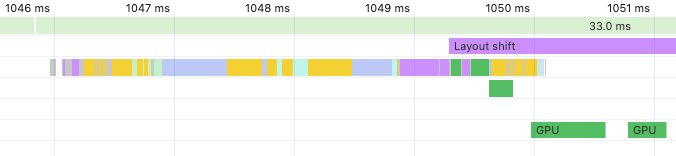
It all looks good. The frame starts with the scroll event dispatched to the event loop within the first millisecond. There’s a flurry of activity, the DOM is updated and the changes committed. The raster thread paints, then the GPU compositor wakes up and completes the frame. Everything done in 5ms.
Bad Frame
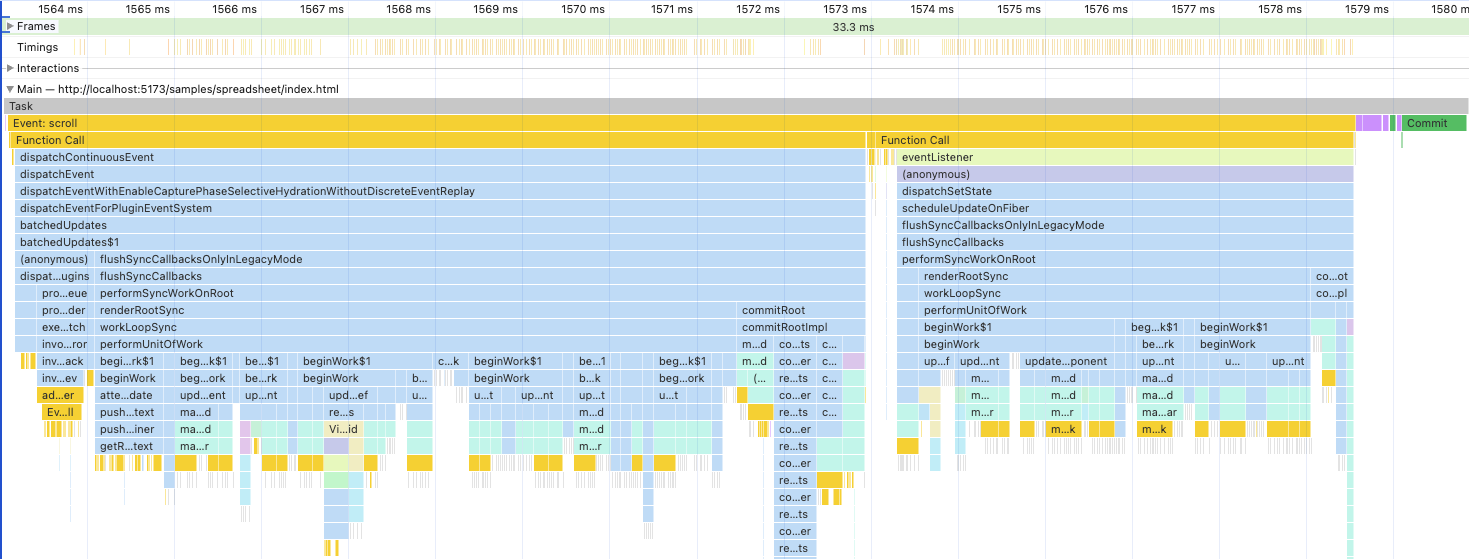
I had to zoom out 2X on the bad frames to fit everything relevant into view.
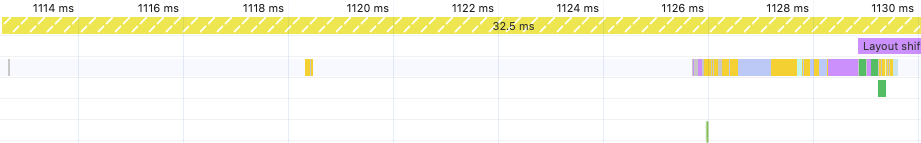
The frame starts but it takes 13ms before the scroll event is dispatched. Rendering and rasterization only takes 4ms this time. However, it’s too late. The GPU compositor woke up briefly just as the event was being delivered, saw that nothing new had been rendered and used the stale content from the previous frame.
Why is the scroll event delayed? No idea. The event loop is doing nothing. In a way it doesn’t matter. Whatever is causing this is outside of my control. I need to deal with the consequences.
Google Sheets
Which made me wonder. Would Google Sheets have the same problem?

It wouldn’t. Google Sheets has virtual scrolling components but all you can see of them is the scroll bars. The grid and headers are implemented as an independent Canvas element. Callbacks from the scroll bars are used to update the rendering offset for the canvas, in the same way that we update the rendering offset for our DisplayList based headers.
The browser may still end up using stale content when it refreshes the screen but you don’t notice because it’s consistent. You either see a fully rendered grid for the previous scroll position or the current one. The content only lags behind while you’re actively scrolling and catches up as soon as you stop. You really can’t tell.
This is also why you never see flashes of blank content in the headers of our spreadsheet. They’re decoupled from the compositor’s scroll handling.
Next Time
Now I know how to fix this. All I need to do is decouple the grid too. Instead of rendering the visible content of the grid into the scrollable area, I can render it using a separate component.
Using the same approach as Google Sheets would be fiddly. You’d have to replicate the browser’s logic that decides whether scroll bars are needed and works out how much space to give them.
Luckily, I have a way to avoid that. I’ll tell you about it next time.