The framework for our event sourced spreadsheet is in place. Entries are being written to the log, snapshots are created at regular intervals, clients start by reading the most recent snapshot and then following along as the log is updated. All this has been done tracer bullet style, with simple code that is largely unoptimized and not scalable.
We’re about to start on the hard graft of filling in the rest of the implementation, making it scalable and optimizing where needed. There’s no sexy new UI features to demonstrate progress. We need another way to track improvements and keep us motivated.
We need a benchmark.
Command Line Apps
My tooling is built around TypeScript and Vite. I like the friction free development experience where TypeScript is transpiled on the fly, without having to think about it. The downside is that Vite is focused on web app development. A benchmark for my internal data structures and file formats makes more sense as something you can run from the command line.
I was vaguely aware that my unit testing tool, Vitest, includes the vite-node package. This lets you run TypeScript files from the command line with a NodeJS runtime. Vitest uses it to run unit tests. It seemed like the obvious choice as it works with the Vite pipeline, so I would still have access to all the Vite plugins I’ve been using.
As I explored further, I came across a comment from one of Vitest’s maintainers saying that vite-node is “softly deprecated”, as the functionality it provides is now available in Vite 6. They recommended tsx for running TypeScript files from the command line, if you don’t rely on Vite plugins.
The new Vite 6 functionality is the Environment API. This provides more formal support for other runtimes built on Vite, like Vitest.
Unfortunately, there doesn’t appear to be a Vite based runtime that provides for simple command line execution.
Vitest Bench
As I was poking around in Vitest, I realized that I’d been looking at too low a level. It turns out that Vitest already has a benchmarking feature built in. It’s marked as experimental but, like browser mode, it’s one of those experimental features that’s been part of Vitest for years.
The documentation is a little sketchy. It took me a while to figure out how everything fits together. Benchmarks are implemented in *.bench.ts files. These look very similar to unit test *.test.ts files but use the bench function to define a benchmark, rather than using test to define a unit test.
Vitest uses tinybench to run each benchmark. Tinybench runs multiple iterations of each benchmark capturing statistics like minimum time, maximum time, mean and percentiles. Vitest accumulates all the results and writes them out at the end in a nicely formatted table.
You run all the benchmarks in your project using the vitest bench command line option. Note that I had to manually adjust my Vite config files to exclude *.bench.ts files from code coverage calculations and production builds.
Write and Read Benchmarks
I’m interested to see how the spreadsheet engine scales as increasing numbers of cells are written. I also want to see how long it takes to read the resulting spreadsheet back into memory.
It’s easy to write code that writes to some number of cells, then reads into another client from the underlying event log and blob store. The problem is that I want to time each part separately. Vitest only times an entire bench function. In the end I created separate utility functions for reading and writing, with global variables to share the event log and blob store between them.
I can then declare benchmarks for writing and reading different numbers of cells and see how things scale.
describe('EventSourcedSpreadsheetData', () => {
  afterEach(() => {
    vi.useRealTimers();
  })

  let writeLog: SimpleEventLog<SpreadsheetLogEntry>|null = null;
  let writeStore: SimpleBlobStore|null = null;

  async function writeEntries(rows: number, cols: number, lastSnapshot: SequenceId) {
    vi.useFakeTimers();

    // Write to rows*cols cells and validate that the last snapshot has
    // the expected sequence id.

    writeLog = log;
    writeStore = blobStore;

    vi.useRealTimers();
  }

  async function readEntries(lastSnapshot: SequenceId) {
    vi.useFakeTimers();

    if (!writeLog || !writeStore)
      throw Error("Nothing was written");

    // Create new client that reads from writeLog and writeSTore and validate that
    // in-memory representation starts with the expected snapshot.

    vi.useRealTimers();
  }

  bench('write 1k entries', async () => {
    await writeEntries(100, 10, 990n);
  }, { time: 1000, iterations: 10, warmupIterations: 1, throws: true })

  bench('read 1k entries', async () => {
    await readEntries(990n);
  }, { time: 1000, iterations: 10, warmupIterations: 1, throws: true })

  bench('write 2k entries', async () => {
    await writeEntries(100, 20, 1980n);
  }, { time: 1000, iterations: 10, warmupIterations: 1, throws: true })

  bench('read 2k entries', async () => {
    await readEntries(1980);
  }, { time: 1000, iterations: 10, warmupIterations: 1, throws: true })
})
I was delighted to find that bench supports async functions. I’m interested in overall compute time, not any of the artificial delays that my reference implementations add to async operations. I used Vitest’s fake timers to remove any async delays and to ensure that all async operations have completed.
I would normally use beforeEach and afterEach to wrap each benchmark with useFakeTimers and useRealTimers. Unfortunately, that results in an infinite loop. Tinybench runs as many iterations as it can within a given time. I suspect that the Tinybench code is running between the calls to beforeEach and afterEach, and getting confused by the fake timers. Everything works as expected when I put the calls to useFakeTimers and useRealTimers inside each benchmark. I left the afterEach in place to make sure we clean up however the benchmark ends.
As benchmarks are a specialized form of unit test, you have access to the full API including expectations and mocks. I used expectations to confirm that the benchmark was doing what I thought it was doing.
Each bench function is passed a set of Tinybench options. You can specify the total time to allow for all benchmark iterations, the number of warm up iterations and the minimum number of iterations to run (regardless of time). The defaults are reasonable apart from the throws option. By default, any benchmark that throws an error (including a failed expectation) is ignored.
I don’t want errors to be silently ignored. There doesn’t appear to be any way to redefine the defaults, so I had to set throws to true for each benchmark.
Initial Results
For my first run I created benchmarks that read and write 100, 1000, 10000 and 100K entries. A snapshot is created every 100 writes, so I started with 100 entries and scaled up in powers of 10.
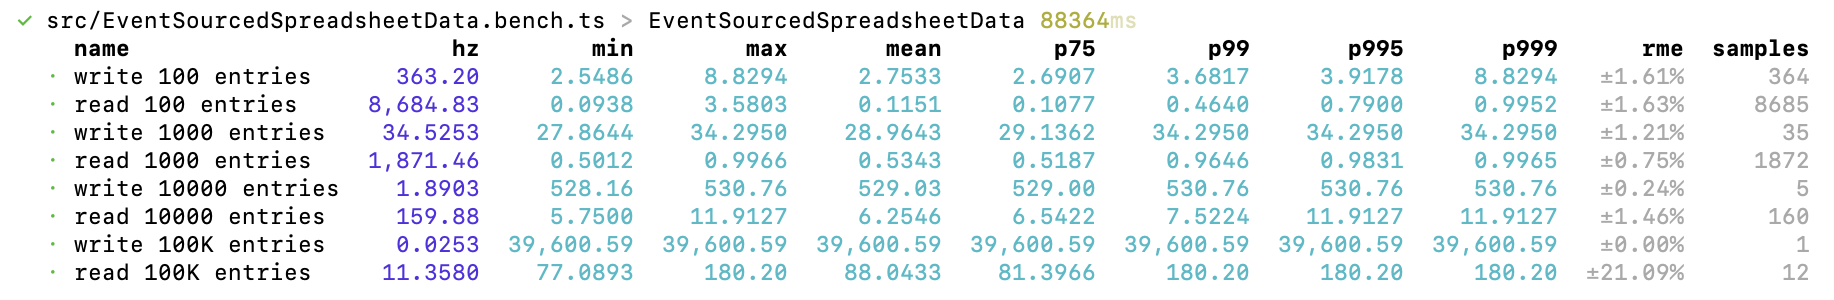
At first glance, there’s an overwhelming amount of data. For my use case it made sense to pick one of the columns (I went with p75 to exclude as many outliers as possible) and compare the results from each benchmark. It’s also worth looking at the samples column to see how many iterations were run for each benchmark. At the top end I only have time for a single sample.
The 100 entries benchmark is too small to provide useful data while the 100K entries benchmark takes too long to run. There are also too few data points to see how things scale.
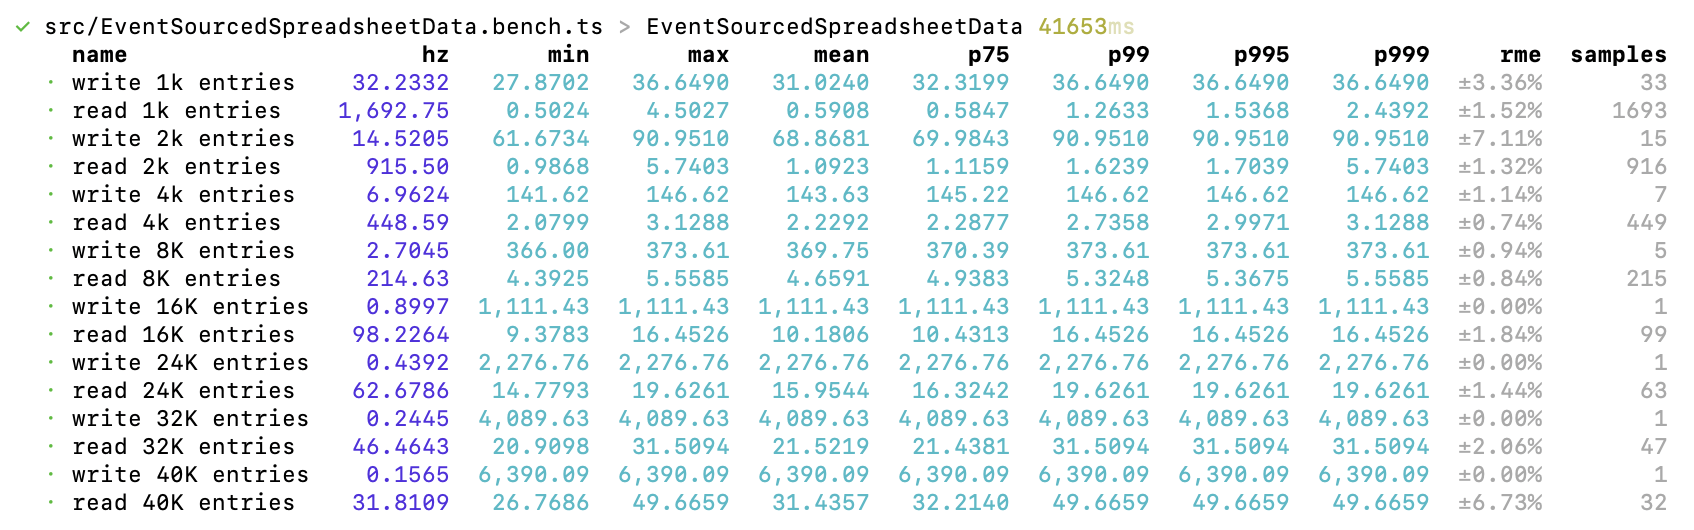
Fine Grain Results
I tried again, starting with 1000 entries and increasing in powers of two. After some experimentation I stopped doubling at 16K entries and went up 8K at a time after that. The complete benchmark runs in half the time with double the number of data points.
I pasted the p75 results into a real spreadsheet and created graphs showing how writes and reads scale.
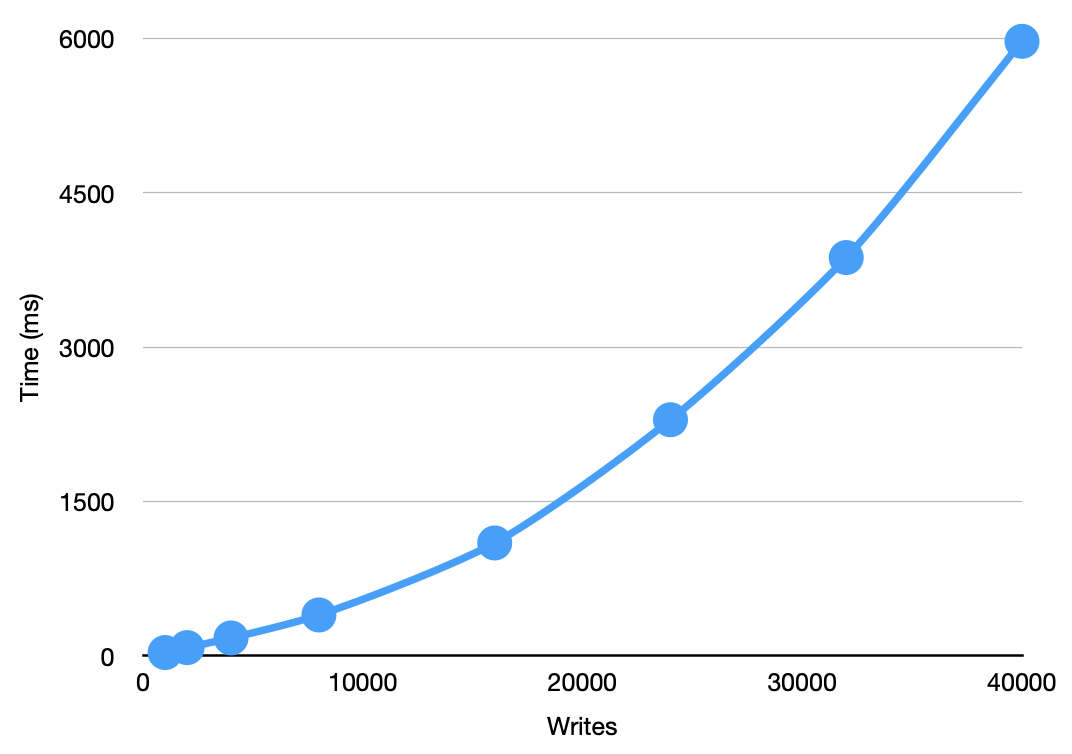
As expected, writes are consistent with an O(n^2) cost. We write out n/100 snapshots with each snapshot containing all the entries so far.
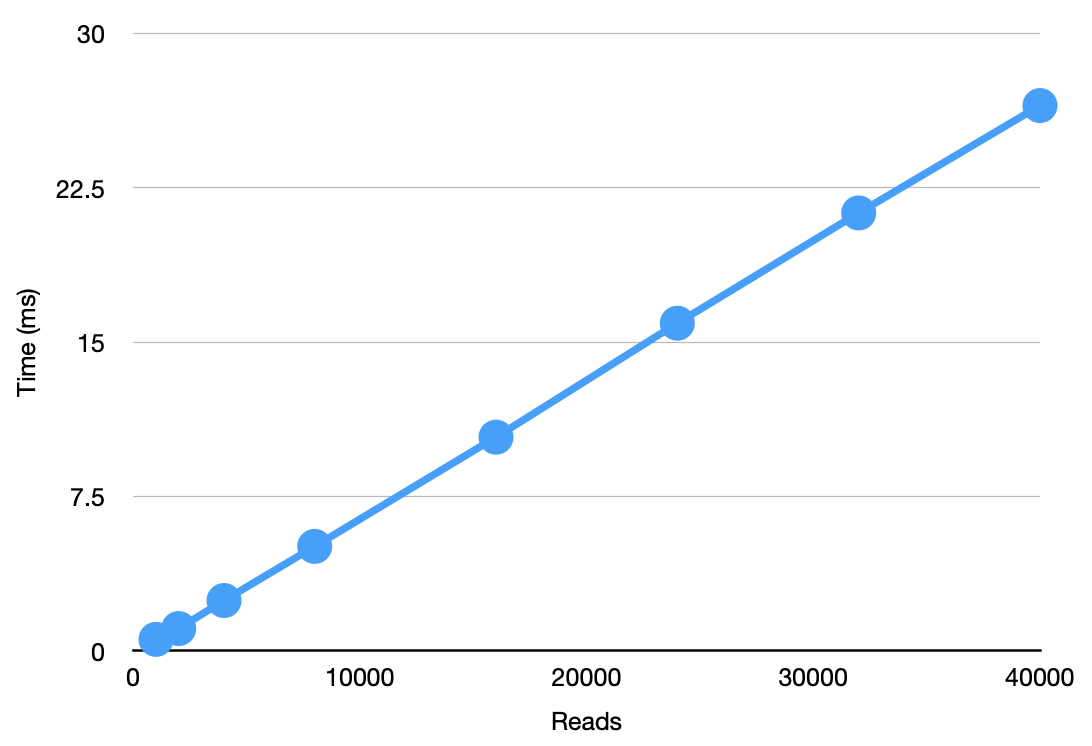
Reads are O(n). We read the entire snapshot containing n entries.
Conclusion
After a couple of false starts, and some fiddling with configuration files, it was easy to create benchmarks with vitest bench. I particularly like the concept of a benchmark as a specialized unit test. I can create a benchmark file for any component I want to profile without having to take care of all the scaffolding around it. I have access to all the unit test helpers needed to profile components in isolation.
I’ve ended up with a good baseline benchmark that demonstrates the scaling characteristics for writes and reads. I’m looking forward to seeing those curves flatten as I implement more scalable algorithms.