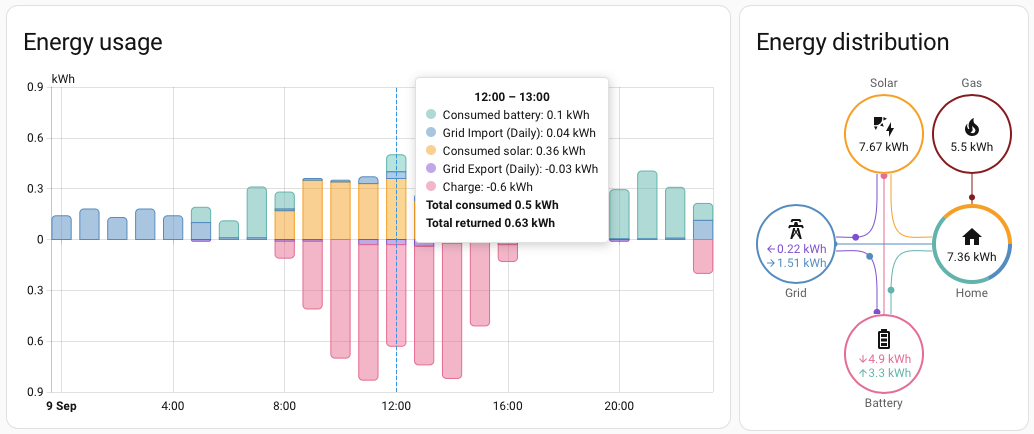
I’m finding the Home Assistant Energy Dashboard to be pretty but not very useful. The main problem is that the data is very coarse grained. The dashboard is driven by Home Assistant’s statistics system and requires metered entities. That is, sensors that track total amounts of energy (kWh), that increase over time.
The metered versions of the Alpha ESS sensors that I have available for solar generation and grid import/export have a resolution of 1.2kWh. They change hourly at best.
The corresponding instantaneous power sensors are more fine grained. They update once a minute (polling the Alpha ESS API) and have a resolution in watts. The Hypervolt charger also has a CT clamp on the main grid connection accessible via API. This works over a web socket with updates pushed from the charger, resulting in a Home Assistant sensor that can update every 3 seconds or so.
Can I convert these streams of power samples into more fine grained increasing measurements of energy?
Documentation
It took me a while to find documentation for the Energy Dashboard. Searching for “Energy Dashboard” doesn’t bring up anything useful. The relevant information is actually under Home energy management.
That last line on the page pointed me in the right direction.
If you have a sensor that returns instantaneous power readings (W or kW), then to add a sensor that returns energy usage or generation (kWh), refer to the Riemann sum integral integration.
Integral
The Integral helper calculates the Riemann sum of the values provided by a source sensor, which is an approximation of the integral of the values. If you plot the samples on a graph against time, this is equivalent to calculating the area under the line.
In more concrete terms, it can take a sequence of samples in Watts and output the total energy produced in kWh.
It picks a representative power value for each pair of samples and multiplies it by the time elapsed between them, then adds the result to the total. By default, it uses the average of the two values. This is called a trapezoidal integration method because it measures the area of the trapezium between the two samples.

You can also use left and right methods which just use one of the sample values, either the left or right respectively. So, which integration method should I use?
I found the documentation unhelpful. It explains that the default is “most accurate”, “if the source updates often”, as it better fits the curve. The left method “underestimates the intrinsic source” but is “extremely accurate” for “rectangular functions which are very stable for long periods of time and change rapidly”. The right method “overestimates the intrinsic source” and is “only appropriate to be used with rectangular functions”.
Which would you choose?
It didn’t make any sense to me. What makes a function rectangular? How can using the left sample always underestimate, and right always over estimate? Doesn’t it depend on the slope of the graph?
If I wasn’t cursed with an enquiring mind I would have gone with the default. The example for converting power readings in Watts to kWh uses the default. If it’s the default it should cover the most common cases, and it says it’s the most accurate, and my power values jump around all over the place, updating often. Right?
Wrong. You almost always want to use left. In fact, it should be your default choice.
There’s nothing magic about the integration methods. I checked the source code. That underestimate and overestimate verbiage is garbage. It does depends on the slope of the curve. It’s only true if the source values are monotonically increasing. Power measurements are very much not.
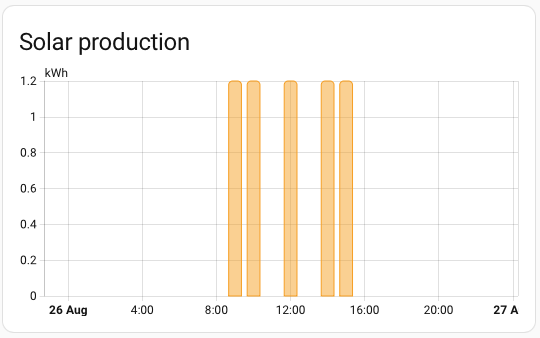
So why left? Due to the way Home Assistant works, most sensors are rectangular functions. They only update (generate a new sample) when the value changes. If there’s nothing to measure, like solar generation in the middle of the night, there can be a long time between samples.
You could have a 0W sample at 7pm when the sun goes down, then nothing until a 200W sample at 7am the following morning when the solar system reaches it’s minimum threshold to start generating power. What power should you add to the sum for the period between 7pm and 7am? Obviously, 0 kWh.
The trapezoidal method will average the two samples, which gives you 100W * 12 hours, or 1.2 kWh. Oh dear.
The left method gives the correct answer of 0 kWh. In general, it assumes that when each sample arrives, the sensor stayed at the previous value for the entire time since the last sample. Which matches how Home Assistant works.
sensor:
  - platform: integration
    source: sensor.instantaneous_generation
    name: "Solar Production Integral"
    method: left
    round: 2
    unit_prefix: k
    unit_time: h
    max_sub_interval:
      minutes: 30
This is the definition for my solar production integral. Unlike automations, you can’t easily switch between the visual editor and YAML. If you create a helper using the visual editor, the definition is stored in the hidden .storage directory. Use the Studio Code Server add-on and pick “File -> Open File” from the hamburger menu to find and look at the hidden files. The exact storage location depends on the type of helper. Integral helpers are stored in core.config_entries using a JSON definition.
If you want to use YAML, create the helper by adding the YAML definition to the top level configuration.yml file.
The unit_prefix and unit_time options together specify that I’d like to convert the input in Watts to kWh. The round option defines the number of decimal places to use in the output. In this case, updating every 10 Wh is plenty.
Finally, the max_sub_interval option forces the sensor to update at regular intervals if the input doesn’t change. This is only relevant if the sensor could output the same non-zero value for a long time. In theory, on a really sunny day, solar generation could reach the 1500W limit of my inverter. If that does happen, I’d like the output sum to increase at least every 30 minutes.
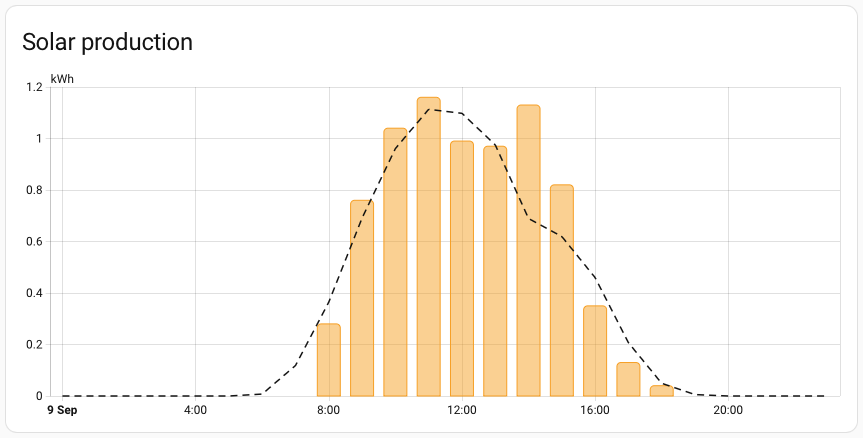
I did wonder whether values based on one minute samples are accurate enough. In my tests the output of the integral matches the Alpha ESS increasing values to at least their 1.2 KWh resolution.
I can now see how well actual solar production matches the solar generation forecast (dashed line).
Separating Import and Export
I have another problem with Grid Import/Export. There’s a single sensor that reports a positive number of watts when importing and a negative number when exporting. I need separate increasing sums for total amount imported over time and exported over time.
The recommended approach is to create two separate sensors for Grid Import and Export using templates. The Grid Import sensor outputs +input when Grid I/O is positive and zero otherwise. The Grid Export sensor outputs -input when Grid I/O is negative and zero otherwise.
template:
  - sensor:
      - name: Hypervolt Grid Import
        unit_of_measurement: W
        device_class: power
        state_class: measurement
        state: >
          {% if states('sensor.hypervolt_grid_power')|float(0) >= 0 %}
            {{ states('sensor.hypervolt_grid_power')|float(0) }}
          {% else %}
            0
          {% endif %}

      - name: Hypervolt Grid Export
        unit_of_measurement: W
        device_class: power
        state_class: measurement
        state: >
          {% if states('sensor.hypervolt_grid_power')|float(0) < 0 %}
            {{ states('sensor.hypervolt_grid_power')|float(0)|abs }}
          {% else %}
            0
          {% endif %}
I’m using the high resolution Hypervolt sensor for Grid I/O rather than the one minute resolution Alpha ESS sensor. A home battery system tries to discharge to match your home’s instantaneous load requirements. There’s always some lag which means there will be small amounts of power imported and exported during the day. It will be interesting to see how accurately I can measure these small values compared with the measurements from the electricity meter.
Once you have import and export separated, you create an integral helper for each as above.
Utility Meter
Utility Meters are a kind of Swiss army knife helper for working with metered entities. You can take a kWh based input and choose how to sum it up over time. You can convert that ever increasing measurement into one that resets daily, monthly, yearly, etc, like a utility bill. You can also allocate the energy to different tariffs with an automation switching the active tariff based on time of day or the value of some other sensor.
Cleaning Dirty Input
The energy dashboard lets you add metered entities that track the power consumption of individual devices. It was natural to add the Hypervolt EV charger. There’s a “Hypervolt Session Energy” sensor that looks like it should be compatible.
It kind of works. You can see the energy consumed during a charging session. Unfortunately, at the end of the session the dashboard shows a large negative value, as if all the energy consumed is handed back. This is because the entity has a state class of TOTAL, which means it reports a net total (can decrease as well as increase).
There is a separate “Hypervolt Session Energy Increasing” entity which is meant to report a constantly increasing total. Unfortunately, it’s currently broken.
The problem can be fixed by wrapping the session energy sensor with a utility meter.
utility_meter:
  energy:
    name: "Hypervolt Session Energy (Daily)"
    source: sensor.hypervolt_session_energy
    cycle: daily
    periodically_resetting: true
    net_consumption: false
    delta_values: false
The periodically_resetting, net_consumption and delta_values options control how the utility meter handles the input. Setting net_consumption to false fixes the problem of negative consumption appearing on the dashboard. Setting periodically_resetting to true ensures that if there are multiple charging sessions in a day, they’re all added up together.
Peak and Off-Peak Load
My current electricity tariff has peak and off-peak periods based on time of day. I charge our home battery during overnight off-peak hours, then discharge it during the day to avoid importing energy at peak rates. At the moment, I assume that the daily peak time load is about 7 kWh when deciding how far to charge the battery.
What if I could measure the actual peak load instead and automatically adjust as our electricity consumption changes with the seasons?
utility_meter:
  daily_energy:
    source: sensor.load_integral
    name: "Load (Daily)"
    cycle: daily
    tariffs:
      - Peak
      - Off-Peak
I created an integral for the Alpha ESS battery’s instantaneous load sensor and used it as input to a utility meter with Peak and Off-Peak tariffs. That in turn creates three entities for me.
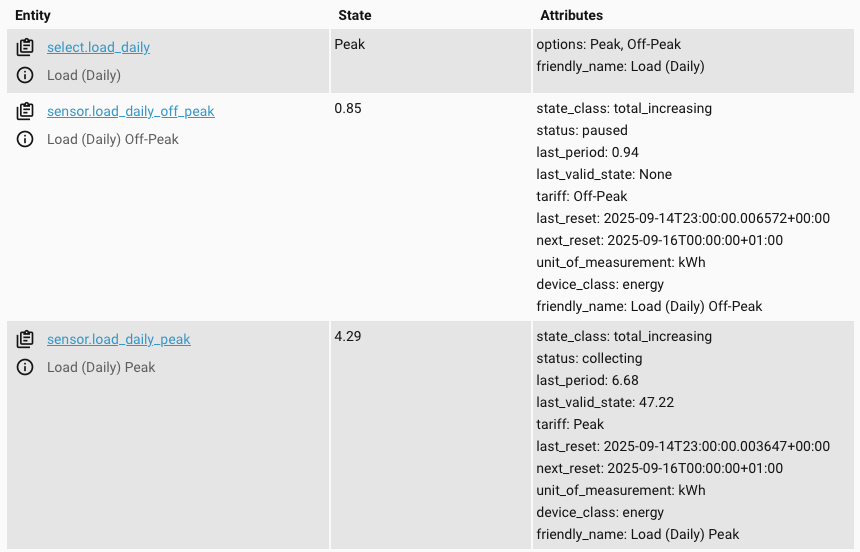
The sensor.load_daily entity lets you switch between Peak and Off-Peak tariffs. The utility meter uses the value of sensor.load_daily to decide whether to increment sensor.load_daily_peak or sensor.load_daily_off_peak. The final piece of the jigsaw is to create an automation that switches been Peak and Off-Peak.
I created a template sensor helper to make that easier. The Octopus Energy integration provides a sensor that turns on during normal off-peak periods. However, that doesn’t include the additional off-peak periods added dynamically when smart charging.
{% if is_state('binary_sensor.octopus_energy_electricity_XXXX_off_peak', 'on') or
      is_state('switch.hypervolt_charging', 'on') %}
  {{ 'Off-Peak' }}
{% else %}
  {{ 'Peak' }}
{% endif %}
I can then use my “Live Off-Peak Electricity” sensor to drive an automation that sets the tariff accordingly.
alias: Select Utility Meter Electricity Tariff
description: ""
triggers:
  - trigger: state
    entity_id:
      - sensor.live_off_peak_electricity
conditions: []
actions:
  - action: select.select_option
    metadata: {}
    data:
      option: "{{ states('sensor.live_off_peak_electricity') }}"
    target:
      label_id: electricity_meter_tariff
mode: single
I added a little bit of future proofing. Rather than directly updating sensor.load_daily, I update all entities with the electricity_meter_tariff label. If I add other tariff based utility meters in future, I just need to add the label to have them automated.
I added the daily peak and off-peak load sensors to the dashboard as individual devices. I configured the hypervolt charger device to use off-peak load as an upstream device. This is meant to prevent the dashboard from double counting the off-peak energy used by the charger.
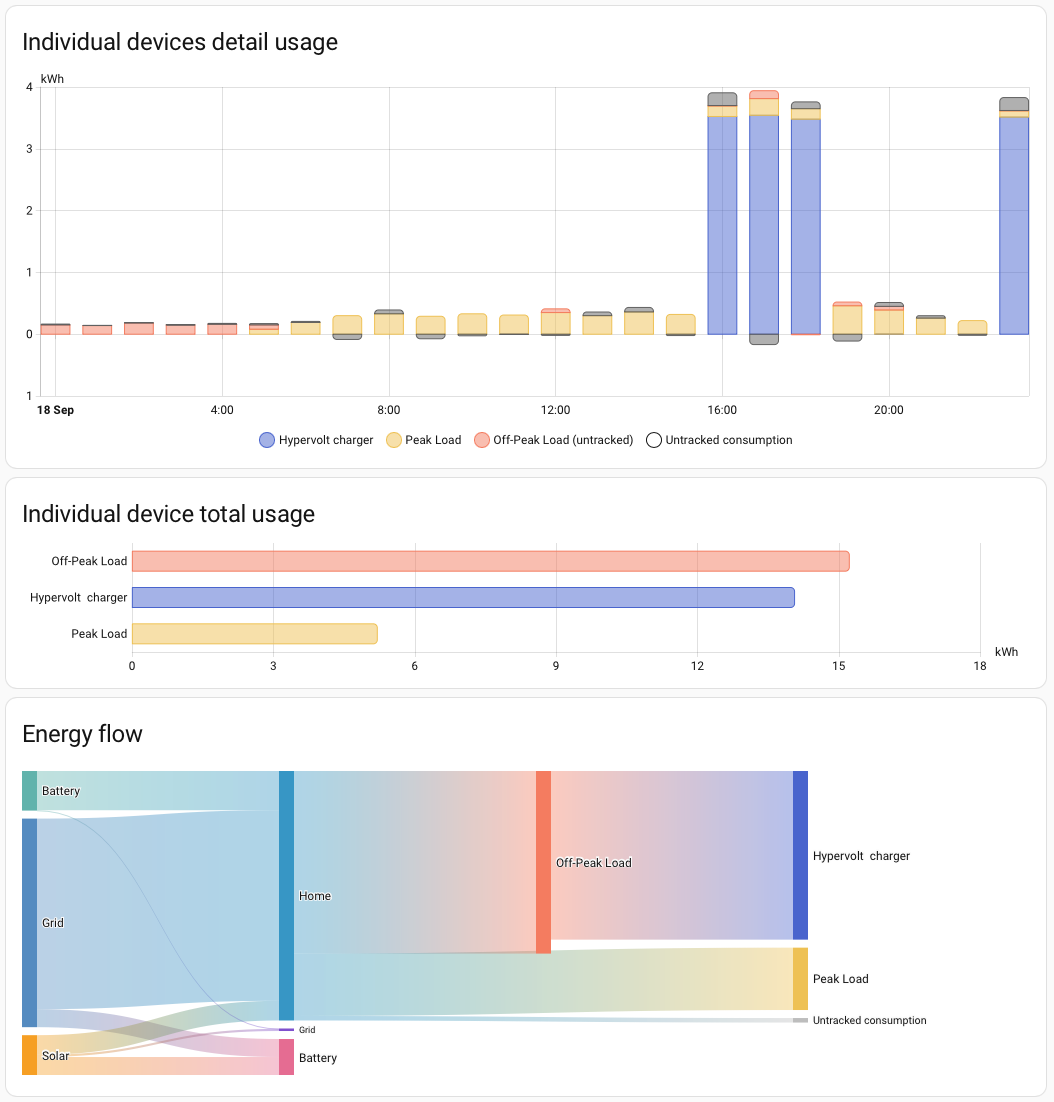
At least it works for two out of the three cards that show individual devices. What do you think? Does it make sense that the total usage chart shows the energy used by the Hypervolt charger twice?
Conclusion
I’ve succeeded in my mission of populating the energy dashboard with more useful, fine-grained energy consumption values.
There’s still an itch that I haven’t scratched. How accurate is my grid import number? Can I compare it with the readings from my electricity meter available from the Octopus integration?
Can I look at peak load over multiple days of the week to see how it varies? The energy dashboard will only show me one day at a time, or totals for a week or month.
I need a custom dashboard.