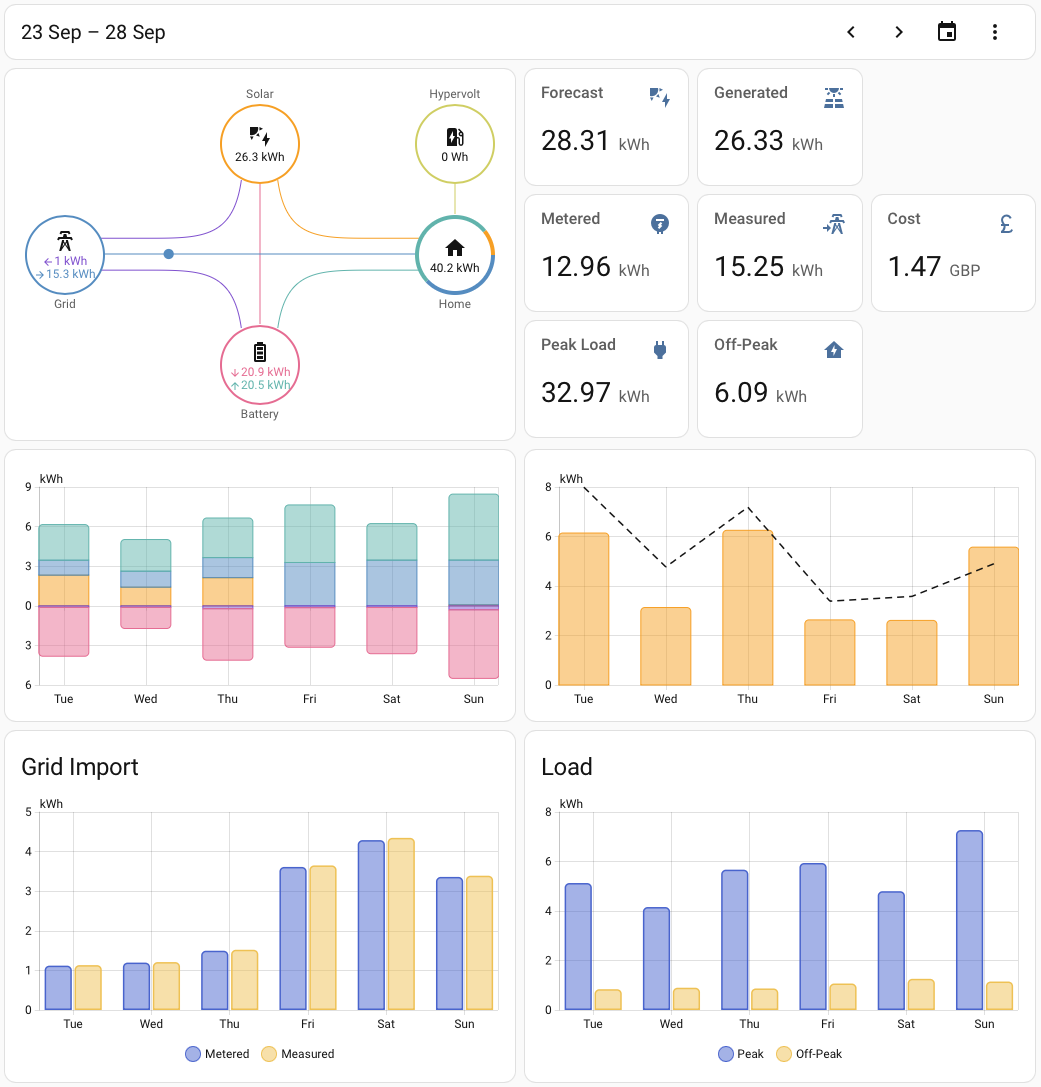
I now have useful data being collected and displayed on the Home Assistant built-in energy dashboard. Of course, it’s not being presented exactly as I would like and doesn’t include all the data sources I’d like. Time to dive into the wonderful world of custom dashboards.
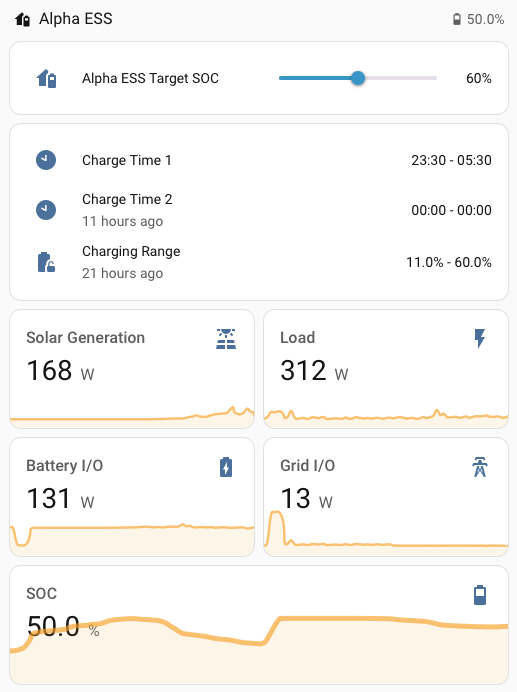
I already created a simple custom dashboard for my home battery, where I threw a few cards together for relevant entities.
I have something more interesting in mind for my next step.
Metered Consumption vs Measured
My energy dashboard is configured to measure grid electricity consumption in close to real time. It uses an integral helper over samples from my Hypervolt charger’s grid CT clamp. I want to see how accurate that is by comparing with the measurements from my electricity meter.
Octopus, my energy provider, makes the previous day’s electricity consumption available via API. The Octopus Home Assistant integration makes the results of this API available as a “Previous Accumulative Consumption Electricity” entity. The state value is the total consumption for the previous day, with the detailed half-hourly meter readings provided as attributes.
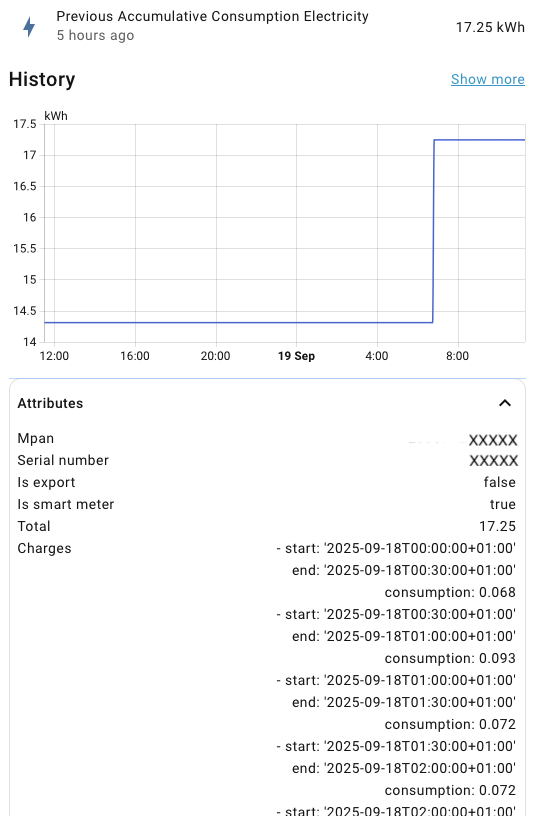
I want to display a bar graph for each half hour period of the previous day, comparing the metered and measured values. The standard dashboard cards can’t do it. There’s no card that supports retrieving points to graph from an attribute. The standard cards also assume that the time to use for historical data is the time that the entity changed.
I need to retrieve the charges attribute from the current “Previous Accumulative Consumption Electricity” entity, draw a series using the dates in the attribute, combined with a series based on the history of my “Grid Import” sensor.
Custom Cards
Fortunately, there’s a rich ecosystem of custom dashboard cards that you can add to your Home Assistant using HACS. For graphing, there are three main contenders: Mini Graph, ApexCharts and Plotly.
All three immediately feel more “advanced” as there’s no visual editor support. YAML is required. They’re listed in increasing order of flexibility, complexity and size.
Mini Graph Card
Mini Graph Card is a more customizable and flexible version of the standard Sensor and History Graph cards for use with sensors. It’s the simplest and most popular of the three.
The look and feel is a good match for the standard cards. It supports line and bar graphs, multiple entities on the same card, and a host of options for controlling the layout and rendering.
Unfortunately, there’s no way to extract data points for an entity from attributes. However, I can use it to display a half-hourly bar chart for 24 hours of grid import.
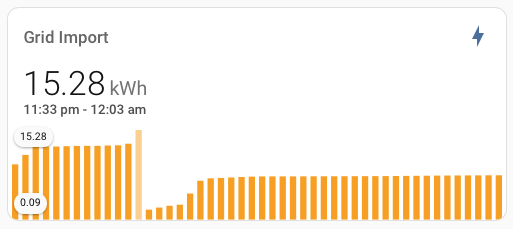
The card shows an unlabelled bar graph until you hover over a bar (pictured). It then shows the value and time range for the bar, and also shows the minimum and maximum values for all the bars.
There’s no way to control when the graph starts and ends. You get a rolling window ending with the current time, which in turn defines the start and end times for each bar.
On the positive side, the card is easy to configure and works well for showing the current state and immediate history for a sensor.
type: custom:mini-graph-card
icon: mdi:lightning-bolt
entities:
  - entity: sensor.grid_import_daily
    name: Grid Import
    show_state: true
show:
  graph: bar
points_per_hour: 2
hours_to_show: 24
aggregate_func: diff
ApexCharts Card
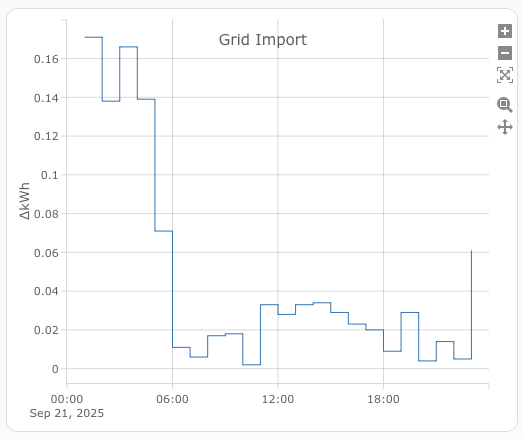
Next up is ApexCharts Card, which is a wrapper around ApexCharts.js. ApexCharts uses modern HTML features including SVG and animations. The default look and feel fits in well with standard cards.
There are lots of configuration options, including extensive control over start and end of period. It’s easy to set up to show a day, week or month’s data beginning at the start of the current period. Here’s how to set it up to show “yesterday”.
graph_span: 24h
span:
  start: day
  offset: "-24h"
You can retrieve series of values for the period using the normal Home Assistant pipeline, querying history or statistics, or by providing a custom data generator. A data generator is a JavaScript function that can make arbitrary queries using the Home Assistant API.
series:
  - entity: >-
      sensor.octopus_energy_electricity_XXXXX_previous_accumulative_consumption
    name: Metered
    data_generator: |
      return entity.attributes.charges.map(({start, end, consumption}) => {
        return [new Date(start), consumption];
      });
  - entity: sensor.grid_import_daily
    name: Measured
    group_by:
      duration: 30min
      func: diff
Here, I’ve used a data generator to define a series using the charges attribute from the most recent state of the electricity meter entity. That’s graphed against a series of half-hourly grid import values.
It’s pretty close, especially given how small the values are. The last couple of days have been really sunny, so I haven’t needed to import any significant amount of electricity. Less than 0.1 kWh per half-hour.
Plotly Graph Card
Finally, there’s Plotly Graph Card, a wrapper around Plotly.js which is in turn built on the D3 visualization library. Plotly is even more flexible and customizable. It supports a huge range of chart types, including 3D charts rendered using WebGL.
The default look and feel is very different from Home Assistant. Out of the box you get the sort of scientific charts that I was generating back in the 80s. Expect to spend a lot of time tweaking styling options.
It’s also harder to use. The Plotly Graph Card documentation misses out some important options that you have to infer from Plotly.js documentation. For example, there’s no mention of how to switch to a bar chart (turns out you need to add type: bar to the series).
I think everything I need is there but it’s a battle digging it out. As ApexCharts does what I needed, I stopped here.
type: custom:plotly-graph
layout:
  title:
    text: Grid Import
entities:
  - entity: sensor.grid_import_daily
    statistic: state
    period: hour
    filters:
      - delta
hours_to_show: current_day
time_offset: "-24h"
refresh_interval: 10
In principle, Plotly is capable of much more than ApexCharts. It has a rich transformation pipeline for manipulating data. You can also embed JavaScript anywhere for ultimate flexibility. It’s the equivalent of a template for a dashboard card.
History vs Statistics
After some effort I’ve managed to produce one of the graphs I want for “yesterday”. What about other dates? What about trends over a week, or several months?
Home Assistant retains the full history of each entity’s value (both state and attributes) for 10 days. You can increase the retention limit but it’s not sustainable for the long term. There’s just too much data.
For longer term statistics, Home Assistant provides a separate statistics recorder for measurements and metered values.
Measurements are sensors with a state_class of measurement. They represent measurements in present time, recorded as they happen. For example, temperature, humidity or power. Measurement statistics are the state’s min, max and mean over a time period.
Metered values are sensors with a state_class of total or total_increasing. They represent total amounts. For example, an energy meter. The total class can go up and down (e.g. net consumption of electricity), while total_increasing always increases (e.g. total import of electricity from the grid). Both classes are allowed to periodically reset to zero (e.g. for a billing cycle).
Metered statistics are stored as the current sum at the end of a time period. You can query the sum at the start and end of a range, or the change between start and end. The energy dashboard is based on metered statistics.
The statistics period is 5 minutes for short term statistics which, like history, are retained for 10 days by default. Long term statistics have a period of one hour and are retained indefinitely.
Short term statistics are useful for queries ending with the current time or with a granularity of less than an hour. Queries automatically use short term, long term or both depending on the start and end point of the query range.
External Statistics
The Octopus “Previous Accumulative Consumption Electricity” entity has been given a state class of total. That seems wrong to me. It doesn’t represent a total over time and it’s not in present time. It certainly doesn’t work properly if you try to use it with the energy dashboard.
To work around this problem, the Octopus integration also extracts each day’s charges and writes the consumption values directly to long term statistics using the corresponding dates. Pairs of half-hourly meter readings are combined into hourly statistics periods.
By convention, external statistics entities have an entity id using a domain:id format rather than the domain.id of a normal entity. You can use external statistics entities with the energy dashboard, Statistics Graph card and Statistics card.
The weirdest thing about these entities is that they have no current state. Most other cards don’t support them. They either report that they can’t use the entity because it’s “Stateless”, or just assume that an entity id without state is invalid.
Annoyingly, ApexCharts does exactly this, even when you configure it to read data from long term statistics. You can work around this using a data generator to read the statistics database yourself. Which feels ugly.
type: custom:apexcharts-card
graph_span: 24h
series:
  - entity: >-
      sensor.octopus_energy_electricity_XXXXX_previous_accumulative_consumption
    name: Metered
    data_generator: >
      const stat_entity =
      'octopus_energy:electricity_XXXXX_previous_accumulative_consumption';

      var statistics = await hass.callWS({
          type: 'recorder/statistics_during_period',
          start_time: new Date(start).toISOString(),
          end_time: new Date(end).toISOString(),
          statistic_ids: [stat_entity],
          period: "hour",
      });

      var stats = statistics[stat_entity];

      var result = [];
      var len = stats.length;
      for (let i = 0; i < len; i++) {
        let stat = stats[i].change;
        result.push([(new Date(stats[i].end).getTime()),stat]);
        }
      return result;
Interestingly, Plotly does support external statistics entities, but I’d rather avoid using it if I can. Let’s park this one for now and look at another problem.
Choosing a Time Period
So far I’ve created graphs with hardcoded time periods. What if I want to change the day, or look at a week or month at a time?
Plotly has a built in range selector UI, but what if I have a whole dashboard of graphs, like the Energy dashboard? It turns out the simplest approach is to use the energy dashboard date selector on your own dashboard.
The energy dashboard is built using a special purpose set of cards. Most functionality is hardcoded. The data source has to be configured using the energy dashboard configurator. You can’t see the cards in the visual editor, but you can add them using YAML.
The cards use a JavaScript API to find a date selector on the current dashboard view and read the specified date range. Recently the Statistics and Statistics Graph cards were given a YAML only option to set their range using the energy date selector. There are also a few custom cards that do the same thing, but sadly not Mini Graph Card, ApexCharts or Plotly.
But maybe I don’t need them. The energy date selector has presets for “Today”, “Yesterday”, “This Week”, etc. You can step forwards and backwards a day, week, month or year at a time. Everything’s aligned to whole days. The Statistics cards already support external statistics entities.
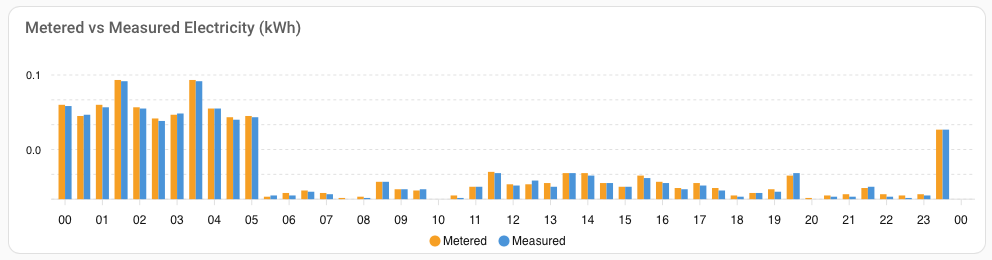
I was able to achieve the equivalent of the ApexCharts Metered vs Measured graph surprisingly easily. It’s only hourly resolution but that’s fine. I can keep the ApexCharts “Yesterday” graph for when I really need the full detail. For everything else, hourly resolution is fine.
chart_type: bar
title: Metered vs Measured
type: statistics-graph
min_y_axis: 0
max_y_axis: 0.5
fit_y_data: true
entities:
  - entity: >-
      octopus_energy:electricity_XXXXX_previous_accumulative_consumption
    name: Metered
  - entity: sensor.grid_import_daily
    name: Measured
stat_types:
  - change
energy_date_selection: true
Statistics Card
The graph is nice but it’s also useful to see the sum for the entire period. Easy enough, let’s add a couple of statistics cards.
type: statistic
period: energy_date_selection
stat_type: change
entity: >-
  octopus_energy:electricity_XXXXX_previous_accumulative_consumption
icon: mdi:meter-electric
name: Metered
type: statistic
period: energy_date_selection
stat_type: change
entity: sensor.grid_import_daily
icon: mdi:transmission-tower-import
name: Measured
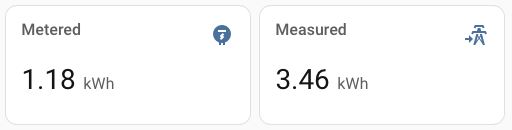
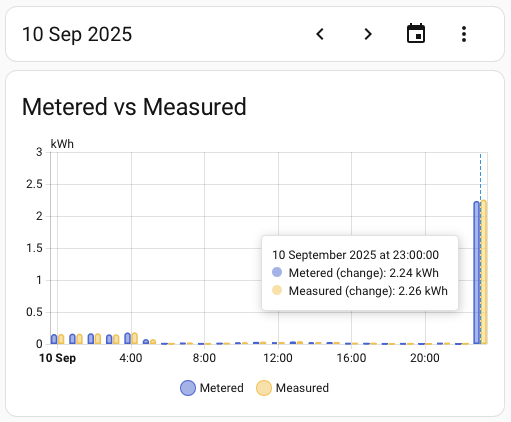
Which is clearly showing the wrong value for “Metered”. The graph shows 2.26 kWh for the last hour alone. A total of 1.18 kWh can’t be right.
Bug Hunting
I started by double checking the expected value. I still had the regular “Previous Accumulative Consumption Electricity” entity in my history. Total consumption for 10th September is 3.42 kWh. I added up the hourly values from the graph. That came to 3.41 kWh, which is close enough. It looks like the statistics card is missing the contribution from the last hour.
What exactly is the range that the Energy Date Selection picker is asking for? The Statistics card supports an explicit fixed_period so I should be able to figure it out by trial and error. My first try was 2025-09-10T00:00:00 - 2025-09-11T00:00:00, which resulted in 3.41 kWh. It looks like the picker is providing the wrong range.
Maybe the picker is using an inclusive range. I tried 2025-09-10T00:00:00 - 2025-09-10T23:59:59, which resulted in 3.26 kWh. Wrong, in a different way, but still including the last hour.
We’re currently on daylight savings time, so I wondered if there was a time zone related problem. I tried shifting the range by an hour to 2025-09-09T23:00:00 - 2025-09-10T22:59:59. Bingo, this time the result was 1.18 kWh.
Which didn’t explain why it works for “Measured”. Or why no one else had noticed what looks like a blatant error.
UTC and Time Zone Awareness
When debugging, you take the information you have, come up with a hypothesis that explains what you see and then look for something that confirms or disproves that hypothesis. I started with the assumption that at least part of the problem is related to time zone handling in Home Assistant.
Internally, all times in Home Assistant are in UTC. Times in the UI and YAML configuration are in local time, based on the time zone defined when you setup Home Assistant.
When I searched for time zone related problems, the most common advice was to make sure that the time zone definition in Home Assistant matched that set at the operating system level. I went as far as installing the Terminal and SSH add-on so that I could confirm that everything was right at the Home Assistant OS level.
After a quick scan through the source code I determined that, as expected, the statistics recorder works with times in UTC. The energy_date_selection and fixed_period times in the statistics cards are passed straight through to the statistics recorder, without any conversion from local time to UTC that I could see. For whatever reason, unlike the rest of Home Assistant, the configuration for the Statistics card is in UTC.
On that basis, there’s nothing obviously wrong with the range from the date picker. It works with other entities, so maybe there’s something wrong with the Octopus external statistics entity.
Octopus External Statistics
My next hypothesis was that there was a problem with the way that the Octopus integration writes to the statistics recorder. Maybe the timestamps it uses are slightly off?
I tried tweaking the Statistics card again to use the range 2025-09-09T23:00:00 - 2025-09-10T23:00:00. Only one second longer, but that was enough to give the correct result of 3.41 kWh.
You can query the statistics database using “Developer Tools -> Statistics” in the Home Assistant UI. You provide a timestamp of interest and the UI shows a handful of statistic entries around that time. There was nothing obviously wrong with the Octopus entries. All as I expected. The missing entry was at 23:00:00 local time, or 22:00:00 UTC. Well within a range ending at 22:59:59.
I compared the timestamps and values with the measured grid import entity. The timestamps were consistent. The only difference was that the UI showed me short term statistic entries at 5 minute intervals, rather than the hour intervals for the Octopus entries.
Hacking a Custom Card
I started to get paranoid that maybe I was wrong about the range that the date picker was using. After all, the values being queried were similar enough that I got the same result for both 2025-09-10T00:00:00 - 2025-09-11T00:00:00 and 2025-09-09T23:00:00 - 2025-09-10T23:00:00.
I found a simple example of a custom card that integrates with the energy date picker. Then hacked it to log the range used to the console. If you want to try this yourself, I have two hard won top tips.
- As well as putting your
custom-card.jsfile inconfig/www, you also have to go to “Settings -> Dashboards -> Resources” (hidden in the hamburger menu) and add a config entry for the file. - Use your browser’s developer tools to disable caching. It’s almost impossible to get the browser to load updated versions of the file otherwise.
What was the actual range? I was pretty close. 2025-09-10T00:00:00.000Z - 2025-09-10T23:59:59.999Z. Only one millisecond different from the range that works.
Statistics Graph vs Statistics Card
I decided to try another line of attack. Why does the Statistics Graph work when the Statistics Card doesn’t? Time for a deep dive into the source code.
The first difference is that the two cards call different query functions in the statistics recorder. The Statistics Graph uses statistics_during_period and the Statistics card uses statistic_during_period. The first one returns multiple values between start and end, at regular intervals. The intervals can be 5 minutes, hours, days, weeks or months. The second one returns a single value for the complete range. Both as expected.
The statistics query reads values from the short term statistics database for 5 minute intervals, and the long term statistics database for the longer intervals. Makes sense.
The statistic query uses a combination of short and long term statistics depending on the start and end points. If the start or end involve a fraction of an hour, the query reads from short term statistics for the partial hour. Then uses long term statistics for the complete hours in the range. Also makes sense.
Then it hit me. The date picker has a partial hour at the end of the range and external statistics entities don’t have any short term statistics. I doubled checked the code. If there are no short term statistics, the final partial hour of the range is ignored.
Confirmation
If I’m right, the same problem would occur with any entity, if you go back beyond the retention period for short term statistics. I put together a test case using a normal entity.
I wrote up a bug report and submitted it. I didn’t expect too much. Development resources on open source projects are at a premium. The last bug report I submitted, against React, has seen no progress after more than a year.
To my surprise I got an acknowledgement of the problem within a few hours, and then confirmation that it had been fixed a day later. I’m now looking forward to the next release.
Conclusion
In the end, I’m happy with where I ended up. I have a custom statistics dashboard which shows me the data I want by day, week, month or whatever time range I want. I can see that my measured grid import is very close to the metered values (not withstanding the Statistics card bug). I can see that my estimate for peak load of 5-7 kWh a day is pretty close to reality, and that the solar forecast is not far off what I actually generated.