Two months ago our prototype Heat Geek NanoStore was rebuilt. Everything looked rosy. All of my outstanding issues were resolved.
Two months later and, subjectively, everything is still working great. However, Open Energy Monitoring tells a different story for my overnight DHW runs.
Now and Then
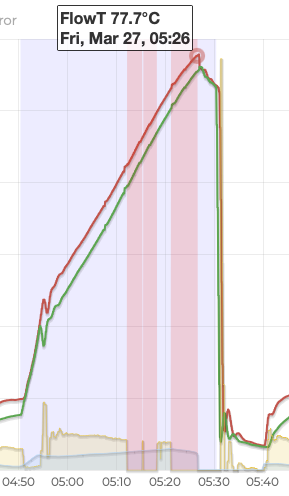
This is a DHW run on March 27th. I’m trying to heat the NanoStore to 60°C. It never gets there. The heat pump keeps ramping up until eventually it hits a flow temperature of 78°C, triggering some kind of internal limit. The heat pump shuts down until the end of the DHW cycle.
The red bars are Open Energy Monitoring errors. The flow meter has stopped working, which is usually caused by air trapped in the system.
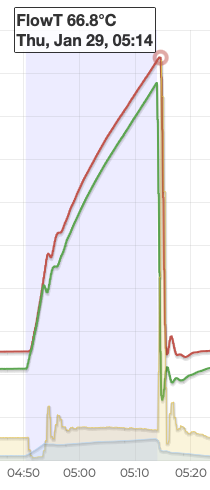
In contrast, this is a run from January 29th. The NanoStore reaches the 60°C target with a maximum flow temperature of 67°C.
Water Heating Theory
Water heating uses 1.16Wh of energy to raise the temperature of 1L of water by 1°C.
I previously worked out that the NanoStore holds 45.5L of water and that its 100Kg of steel has the same heat capacity as 12.5L of water. The NanoStore has two separate circuits, each holding 22.75L of water.
During a DHW run, the heat pump circulates hot water through one circuit, which heats the water in the other circuit and the body of the heat exchanger. Open Energy Monitoring determines the energy transferred to the NanoStore based on the difference between the flow and return temperatures of the water circulating through the NanoStore.
The energy is used to raise the temperature of the 22.75L of water in the other circuit and the 12.5L of water equivalent in the steel body. Raising the temperature of 35.25L of water by 1°C needs 40.89Wh of energy. 1kWh is enough to raise the NanoStore temperature by 24.5°C.
When the DHW run ends, the water flowing through the heat pump circuit is trapped in the store. We know exactly how hot this water is. It’s stratified with the final flow temperature at the top and the return temperature at the bottom. The average temperature should be pretty close to the average of flow and return temperatures.
We only have a vague idea of how hot the other circuit and heat exchanger body is. Temperature is measured on the outside of the heat exchanger near the bottom. This tells you the minimum temperature of the store.
In January, before the insulation was applied, I was able to measure temperatures at various points on the store after a DHW run. The store is heavily stratified. There’s at least a 10°C difference between the measured temperature at the bottom and the actual temperature at the top of the store. The temperature distribution is also non-linear. After heating, there’s not much drop between the top and middle of the store, then a much bigger drop to the bottom.
A plate heat exchanger with water flowing through both circuits will usually manage to heat the top of the cold circuit within a degree or two of the incoming flow temperature through the hot circuit. During a DHW run there’s no flow through the cold circuit. In my test, temperature at the top of the store was within 5°C of the final flow temperature.
January 29th
Let’s see how the theory stacks up against each DHW run. On January 29th, Open Energy Monitoring shows that 1.37kWh of heat was added, using 0.833kWh of electricity at a COP of 1.64. The peak flow and return are 66.8°C and 63.8°C.
The measured tank temperature at the start of the DHW run was 30°C (last heated after a shower at 8pm the night before). There’s enough energy to raise the store temperature by 33.5°C.
If we assume that the 30°C starting temperature had equalized through the store then we’d end up with an average temperature of 63.5°C at the end, before accounting for any heat loss.
This stacks up pretty well given the 60°C measured at the bottom and the 66.8°C peak flow temperature at the top.
March 27th
So, what went wrong on March 27th?
Open Energy Monitoring shows 1.677kWh of heat added, using 1.414kWh of electricity. However, that excludes whatever heat was added during the error bars, when the flow meter wasn’t working.
The three minutes of data recorded between the two error bars generated 0.177kWh of heat. There’s 12 minutes of data missing either side. If I fill in the gaps using the recorded data that would give a total of 1.677 + 4 * 0.177 = 2.385kWh heat at a COP of 1.68. The peak flow and return are 77.7°C and 75.7°C.
The starting tank temperature was 23.5°C. Adding enough energy to raise the temperature 58.3°C gives an average temperature of 81.8°C at the end. At these kinds of temperatures there will be significant heat loss from the store but it seems likely that the actual store temperature is well above the 60°C we were aiming for.
I used Home Assistant to plot a graph of flow temperature and measured tank temperature over time. The myVaillant controls only update the tank temperature reading every 5 minutes, so the data is quite coarse.
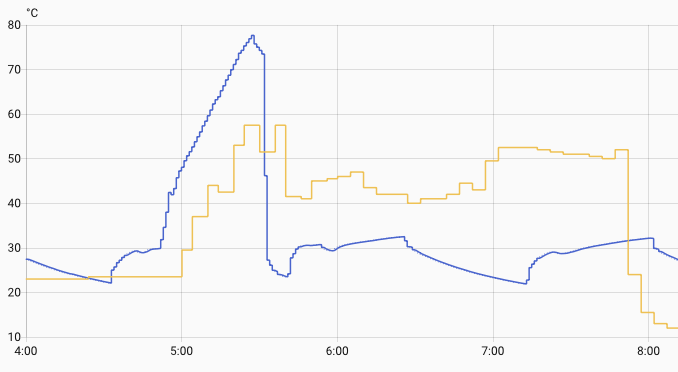
The measured tank temp doesn’t quite reach the target of 60°C. More importantly, the temperature sensor is all over the place. There’s some crazy values reported. Either conditions in the store are turbulent or the sensor is misbehaving.
My best guess is that the store is reaching 70+°C but for whatever reason the temperature sensor is seeing 20°C less with lots of variation. Is the sensor on the other side of an air bubble? Or maybe it’s become slightly detached from the side of the heat exchanger? Or perhaps it’s just a dodgy sensor.
Bleeding Radiators
Open Energy Monitoring has advice on removing air from heating systems. There’s lots of talk about Automatic Air Vents (AAVs). I have no idea if I have any AAVs or how to use them if I did.
There is one mention of bleeding the highest radiator. That I can do.
There was lots of trapped air. Enough to reduce system pressure by 0.2 bar when I released it. I topped the pressure back up and waited to see what would happen in the next DHW run.
March 30th
To my surprise that fixed the reported air issues. It seems counter-intuitive that removing air from the top of the heating circuit will have an effect on the DHW circuit but I guess it’s all interconnected.
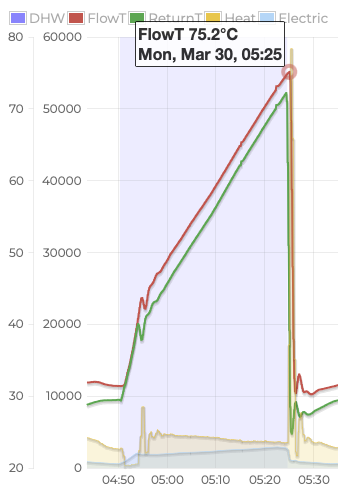
There was 2.183kWh of heat added, 1.302kWh of electricity used, COP 1.68. Peak flow and return are 75.2°C and 72.2°C. The tank starts at 25°C, gains energy to add 53.4°C, giving a theoretical 78.4°C at the end.
We did hit the 60°C target this time, but we’re still adding far more energy than needed and still reaching excessive flow temperatures. There’s some odd behavior from the temperature sensor, but not as extreme as before.
Eco Mode
The most efficient way of heating water with a heat pump is to go slowly and stop at the lowest temperature you can. Vaillant heat pumps have an Eco mode that limits the heat pump’s compressor to operate in its most efficient range. This is perfect if you have a large cylinder and can heat all the water you need overnight.
The constraints are different with a NanoStore. The one we have holds just enough heat for a quick shower. For a long shower you rely on the heat pump running at full power in “combi” mode. Eco mode is a global setting. There’s no convenient way to turn it on for overnight DHW runs and off during the day.
However, you can achieve the same effect using noise reduction mode. Noise reduction mode also limits the compressor and, crucially, can be setup to run on a schedule. I enabled noise reduction mode for overnight DHW runs soon after getting the heat pump.
By default, noise reduction mode is less aggressive than Eco mode. You can change this with the compr. noise reduct. setting, which is buried in the installer menu in the heat pump appliance interface (the wall mounted white box, not the SensoComfort controller). The default reduces the compressor by 40%. The maximum is 60%, which is equivalent to Eco mode.
My hope is that using this to heat more slowly will allow the temperature sensor to catch up with the actual temperature in the store. Saving a bit of electricity is a nice bonus.
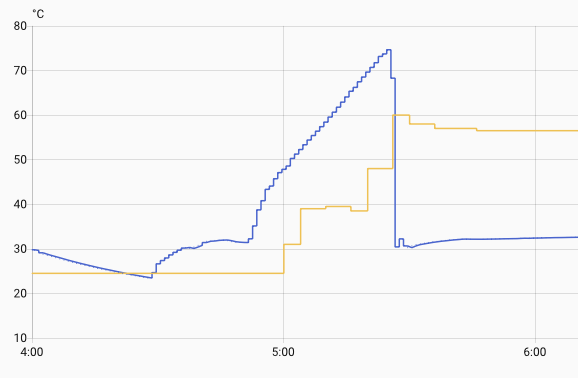
March 31st
I started the DHW run 10 minutes earlier to allow for slower heating.
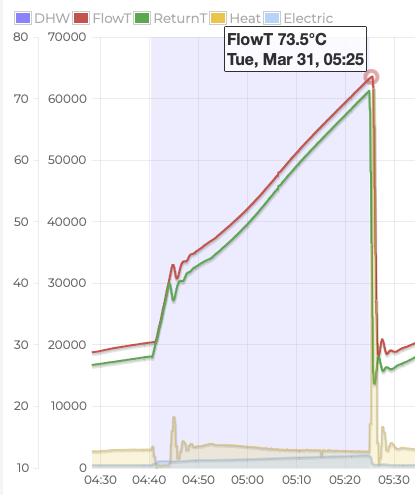
The run takes 45 minutes compared with 35 minutes with the previous settings. The heat pump is definitely using less power and ramping more slowly. We added 2.357kWh of heat, using 1.217kWh of electricity, for a COP of 1.94.
Peak flow and return are still too high at 73.5°C and 71.2°C. The tank started at 22°C, gains energy to add 57.6°C, giving a theoretical 79.6°C at the end. Very similar to yesterday. At least it is a bit more efficient.
The longer run gives us more temperature samples. You can see pronounced fluctuations in measured tank temperature as the flow temperature ramps up.
Home Assistant
The theoretical temperature in the tank, given energy added, tracks flow temperature pretty well. It’s a few degrees less early in a run, a few degrees more at the end. Instead of ending the DHW run using the lottery that is the temperature sensor reading, I can use Home Assistant to forcibly end it when we hit a target flow temperature.
I already use this approach for boost showers during the day, so it’s not unknown territory. However, I would like the overnight DHW runs to primarily use the Vaillant schedule so that they still happen even if something goes wrong with Home Assistant.
I added a Home Assistant automation that drops the target tank temperature when we hit the required flow temperature. This will indirectly end the run. I have other automations that manipulate the target tank temperature during the day, so it should fit in nicely.
triggers:
  - trigger: numeric_state
    entity_id:
      - sensor.emonhp_returnt
    above: 65
conditions:
  - condition: time
    after: "04:30:00"
    before: "05:30:00"
  - condition: numeric_state
    entity_id: sensor.emonhp_dhw
    above: 0
actions:
  - action: water_heater.set_temperature
    metadata: {}
    data:
      temperature: 40
    target:
      entity_id: water_heater.home_domestic_hot_water_0
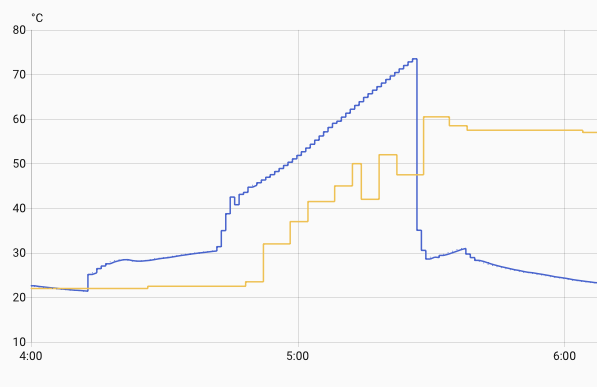
April 1st
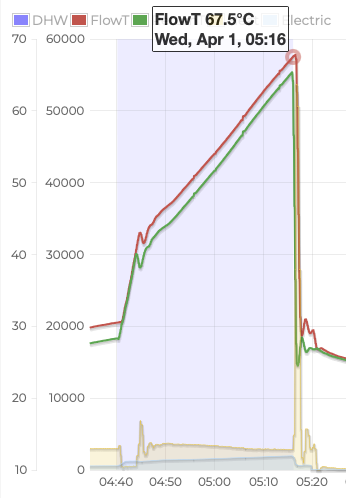
That looks better. We added 1.831kWh heat, using 0.931kWh electricity, for a COP of 1.97. Peak flow and return temperatures are 67.7°C and 65.4°C. The tank started at 24.5°C, gains energy to add 44.8°C, giving a theoretical 69.3°C at the end. The run time is back down below 40 minutes.
Cold Hard Cash
I have two months of cost data with the rebuilt NanoStore. It’s hard to say what impact, if any, the changes had on cost. The seasonal reduction in heating demand and increase in solar generation have a much bigger impact.
| Month | Old Gas | New Gas | Old Elec | New Elec | Old Total | New Total | Reduction |
|---|---|---|---|---|---|---|---|
| November | 85.12 | 11.26 | 40.47 | 92.22 | 125.59 | 103.34 | 18% |
| December | 101.96 | 11.42 | 43.00 | 111.43 | 144.96 | 122.85 | 15% |
| January | 134.25 | 11.88 | 44.08 | 138.02 | 178.33 | 149.90 | 16% |
| February | 108.09 | 10.31 | 37.32 | 101.27 | 145.41 | 111.58 | 23% |
| March | 79.18 | 11.32 | 36.67 | 62.03 | 115.85 | 73.35 | 37% |
It’s clear that we saw a small reduction in costs even during the coldest months and that we should see more savings as more of our demand can be met using our home battery. In March, we had 21 days where all, or nearly all, of our imported electricity was at off-peak prices.
There’s another £100 in annual savings when I get round to replacing our gas hob and removing the gas supply.
Conclusion
It’s well worth bleeding your highest radiator every so often. Trapped air can lead to all kinds of weird behavior.
My DHW runs are back under control, despite the dodgy temperature sensor. Damon, my installer, has ordered a replacement.