Now that we have a heat pump up and running, the obvious next job is to get it hooked up to Home Assistant. Our heat pump is a Vaillant AroTHERM plus. A quick search of the Home Assistant Community Store turns up the myVAILLANT integration, which uses the same API as Vaillant’s myVAILLANT app.
We also have Open Energy Monitoring installed which sends data to their Emoncms.org backend. There’s a built in Home Assistant integration for that.
myVAILLANT Integration
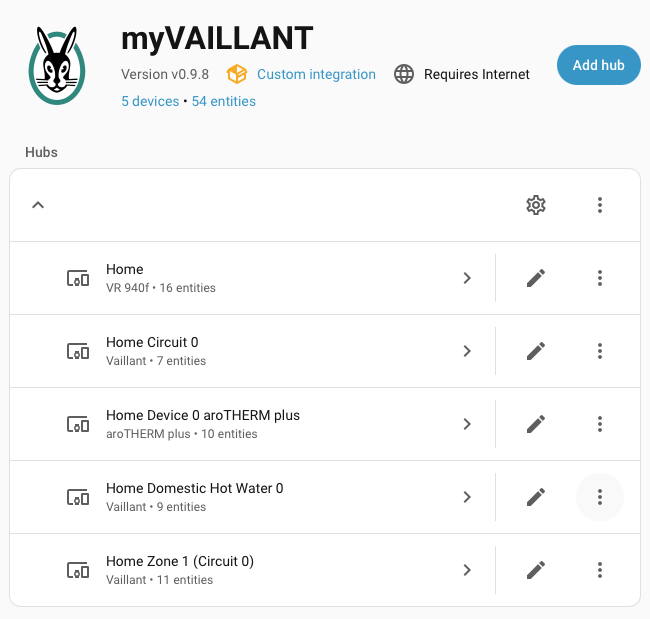
When I first added the myVAILLANT integration it hadn’t been updated in 5 months. There was some nervous chatter wondering if it had been abandoned. Someone was promoting their own fork but that hadn’t been updated for 3 months either. There were another 30 older forks too.
I decided to go with the original and see how I got on. To configure the integration you need the email address and password you use with the myVAILLANT app. You then have a long list of options for what types of data you want to retrieve and how often to retrieve it.
It seems that Vaillant enforces an aggressive quota on calls to their API. There are lots of warnings about “quota exceeded” errors if you ask for too much data too frequently. I started with the defaults, which update most sensors every 5 minutes. That’s OK for long term trends but not much use if you’re trying to understand what’s going on during a single heating cycle.
You get access to indoor and outdoor temperature, flow rate, flow temperature, water temperature, system pressure and all the settings you can tweak in the app. There’s also data about energy use but, like the app, it’s infrequently updated and coarse grained.
A few days ago, most of the sensors became “unavailable” and the Home Assistant logs started filling up with “quota exceeded” errors. Vaillant had tightened up their quotas again, with some APIs limited to one call an hour. After changing the update rate to once an hour, the integration limped back into life.
At this point the repo burst into action and there were a succession of new releases trying to fix the problem. Vaillant appeared to have set their quotas to match query patterns from their app. The APIs with ultra low quotas were for data that changed infrequently, like the current time zone. Clearly the app was caching more aggressively than the integration. After a short game of whack-a-mole all the effected APIs were cached in the integration too. There were also additional options to further restrict the data returned.
After using the integration for a few days I knew that I only needed the standard set of data. Once I turned off all the optional data, the handy “Vaillant API request count” sensor showed me that the integration was averaging 2-3 calls per update. I was able to increase the update rate to once a minute without exceeding the quota.
I was very pleased with myself until I noticed that the reported values change much less frequently than once a minute. This seems to be something on the myVAILLANT side. I see the same behavior in the app. According to some, the SensoCOMFORT controller only reports changes every five minutes. At least now the values reported by the app and Home Assistant change at the same time.
Emoncms Integration
Open Energy Monitoring hardware was setup and configured as part of the heat pump installation. It’s primarily there for additional monitoring by our installer, Heat Geek. That doesn’t stop me figuring out what I can do with it too.
The data gets sent to Emoncms.org. Poking around their web site reveals that they have a pay-as-you-go pricing model. You need an API key to access the data. However, it looks like you pay for data written not read. When you buy the hardware you get API credits that should be good for several years. Best case scenario, it’s all been paid for and I just need someone to give me access.
I asked Damon, our local Heat Geek, and he put me in touch with his contact at Open Energy Monitoring. They sorted me out with an API read key.
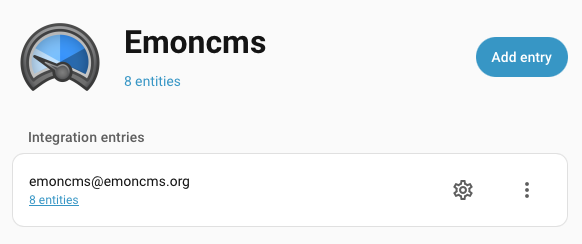
You’re asked for a server URL and API read key when you configure an instance of Emoncms in Home Assistant. After that you’re presented with a list of data feeds that you can subscribe to. Data feeds are equivalent to sensors in Home Assistant. That is, a measured or calculated value over time. Unsurprisingly, the integration creates a sensor in Home Assistant for each feed you select. Strangely, the sensors are “loose”, not associated with any device. This means they appear at the top level of the oveview dashboard, mixed in with your own helpers and templates.
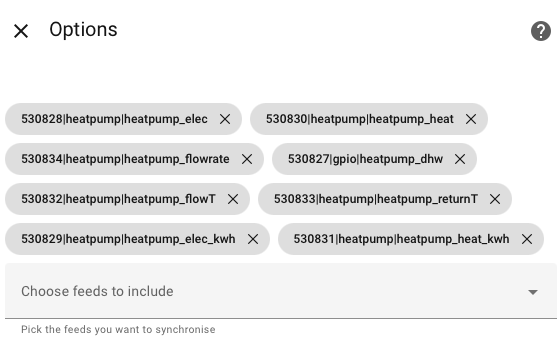
There were 8 feeds that looked useful. You get flow rate, flow temperature and return temperature from the heat meter, together with calculated values for heat power and energy generated (in Watts and kWh). The electricity meter gives you power and energy consumed (also in Watts and kWh). The final feed is the DHW sensor which is either 0 when the heating circuit is active or 1 when the DHW circuit is active.
The integration is hardcoded to retrieve values once a minute.
Home Battery
Now that I’ve got all that data, what am I going to do with it? My most pressing problem is our home battery. We charge the 10kWh battery overnight when electricity is cheap. I have a Home Assistant automation that sets the target state of charge based on our typical electricity consumption (5-7kWh) and the next days solar generation forecast (0-10kWh).
Our typical electricity consumption is going to look very different now that we have a heat pump. It’s also going to vary hugely depending on the season.
We run the heat pump using weather compensation. The energy generated is based entirely on the difference between the outdoor temperature and the desired indoor temperature. If I have a good hourly weather forecast for the next day, I should be able to create a heating forecast that I can add into the battery state of charge automation.
Met Office Weather
Home Assistant comes bundled with weather forecast and solar generation forecasts based on data from the Norwegian Meterological Institute. I found the solar generation forecast to be inaccurate in the UK and moved on to one from Open-Meteo. This is meant to use data from a variety of national weather services, including the UK’s Met Office. The solar forecast is a great improvement, however the weather forecast is often inaccurate and doesn’t match the forecast on the Met Office’s own web site.
Time to go direct. Home Assistant includes a Met Office integration out of the box but it needs an API key. Fortunately, getting one is free and pretty painless.
Register an account at Met Office DataHub. All you need is a valid email address. Choose the Global Spot subscription and pick the free plan. Copy the ludicrously long API key and paste it into the integration’s options page.
Predicting Heating Demand
The heat pump needs to produce enough heat to counter-balance the heat loss from the building. Heat loss calculations are complex but the underlying formula is simple. It boils down to Heat Loss = House specific constant * dT where dT is the difference between outside temperature and desired indoor temperature.
The heat pump system design produced by our installers says that we have 6.11kW heat loss at 18°C inside, -3°C outside. That’s a dT of 21, with a heat loss of 291W per degree. I’m going to assume passive gain of 3°C from occupant heat, solar gain, electrical devices, etc. That matches the Vaillant heat pump OT threshold setting. This is the outside temperature above which the heat pump won’t bother turning on. You typically set that at 3°C below your target indoor temperature. In our case that’s 17°C, so dt = 14 - outside temperature.
The idea is simple. Get the hourly weather forecast for tomorrow and determine dT for each hour. Sum up 291 * dT for each hour to get the watt hours of heat needed. The electrical power needed to generate that heat is heat needed / COP. Actual COP depends on your installation, outside temperature and flow temperature.
Our design includes a minimum efficiency guarantee COP of 3.8 at -3°C. At the current outdoor temperature of 10°C the measured COP is about 5. I’m going to start with a naive linear interpolation between 5 and 3.8 for temperatures below 10°C, then adjust as I get more real world data.
{% set forecasts = forecast['weather.met_office_crookes'].forecast | list %}
{% set start = today_at('07:00') + timedelta(days=1) %}
{% set end = today_at('21:00') + timedelta(days=1) %}
{% set ns = namespace(sum=0.0) %}
{% for slot in forecasts %}
  {% set dt = slot.datetime | as_datetime %}
  {% set t = slot.temperature | float %}
  {% if dt >= start and dt <= end and t < 14 %}
    {% set cop = 5.0 %}
    {% if t < 10 %}
      {% set cop = 5.0 - (10 - t) * 0.0923 %}
    {% endif %}
    {% set ns.sum = ns.sum + (14 - t) * 0.291 / cop %}
  {% endif %}
{% endfor %}
{{ ns.sum | round(3) }}
We currently run the heat pump between 7:00 and 21:00 in peak time, then again during off-peak hours between 23.30 and 5.30. I’m only interested in heat demand during peak time. I store the output in a helper entity so that I can show the heating forecast on a dashboard, generate statistics, etc.
The Jinja templating language used by Home Assistant has some quirks. One of them is that you can’t modify variables defined at an outer scope (such as incrementing a sum inside a loop), unless you define them within a namespace.
Statistics
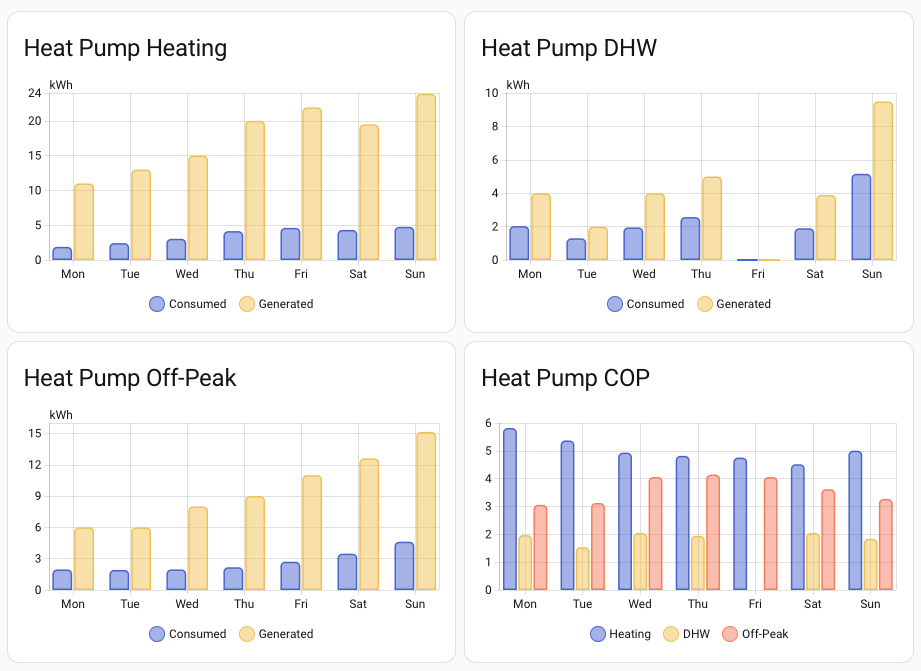
I use the heat pump in three different modes. There’s heating during the day, hot water (DHW) during the day and preloading during off-peak hours. My off-peak overnight electricity is a quarter of the price during the day. I charge the battery, charge the hot water system with as much heat as I can and charge the house with heat too.
I want to understand energy consumption and efficiency for each mode. The energy stats from myVaillant are too coarse grained and infrequently updated. The Emoncms integration gives me total increasing sensors for electricity consumed and heat generated in kWh. Perfect for statistics. I use a utility meter to split the energy sensors into three separate daily sensors for Heating, DHW and Off-Peak.
That’s when I discovered that the heat meter provides readings with a 1kWh granularity. Apparently this is common with hardware heat meters. Weirdly, the meter is happy to provide power readings in watts. I used an integral helper to convert the power readings into my own accumulated energy sensor.
I use a template sensor to calculate COP for Heating, DHW and Off-Peak each day. It involves a bit of a hack to make COP based statistics useful. The sensor is marked as unavailable for the period during the day before the overall COP is calculated. This avoids having the previous days value used for average/max/min statistics. It’s then easy to use the Home Assistant statistics graph to create statistics dashboards.

I also have an overview section that gives me a high level summary. I can see that my heat energy integral (Generated) is close to the heat meter reading (Metered) over time. In contrast, my peak time heating forecast (Forecast) is consistently too high when compared with the actual heat used (Consumed). I’ve been steadily reducing the heat curve since I implemented the forecast as actual heat loss is lower than the estimate from the design.
We’ve also had a few colder days recently, down to 5°C. To my surprise, COP is still around 5. It’s not cold enough for the heat pump to run continuously, so it’s still at minimum power (where it’s most efficient) with longer cycles (also more efficient). I suspect COP will stay around 5 until I hit the point where the heat pump runs continuously and then has to ramp up the power.
Time to go back and tweak the forecast.
Heat Pump Dashboard
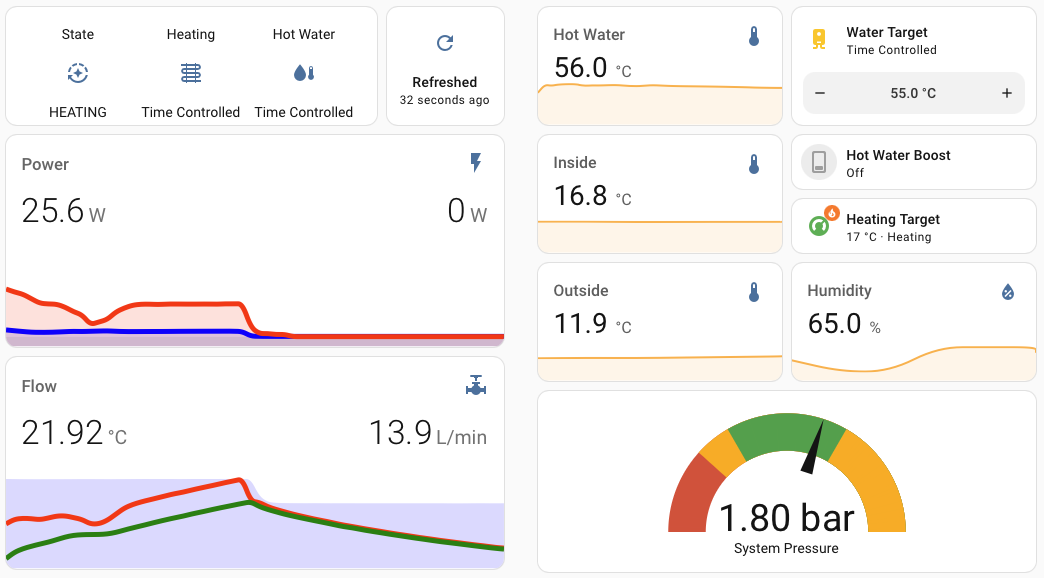
I put together a summary dashboard that shows the current state of the system together with recent activity. I used sensor cards for the basic temperature sensors. I tried something more sophisticated for Power and Flow. These are Mini Graph Cards that each combine 3 sensors on one graph. The Power card shows electricity consumed (blue), heat generated (red) and changes the background shading during a DHW cycle. The Flow card shows flow temperature (red), return temperature (green) and flow rate (blue shading).
I had some fun configuring a gauge card to show system pressure with custom colors for warning and error zones.
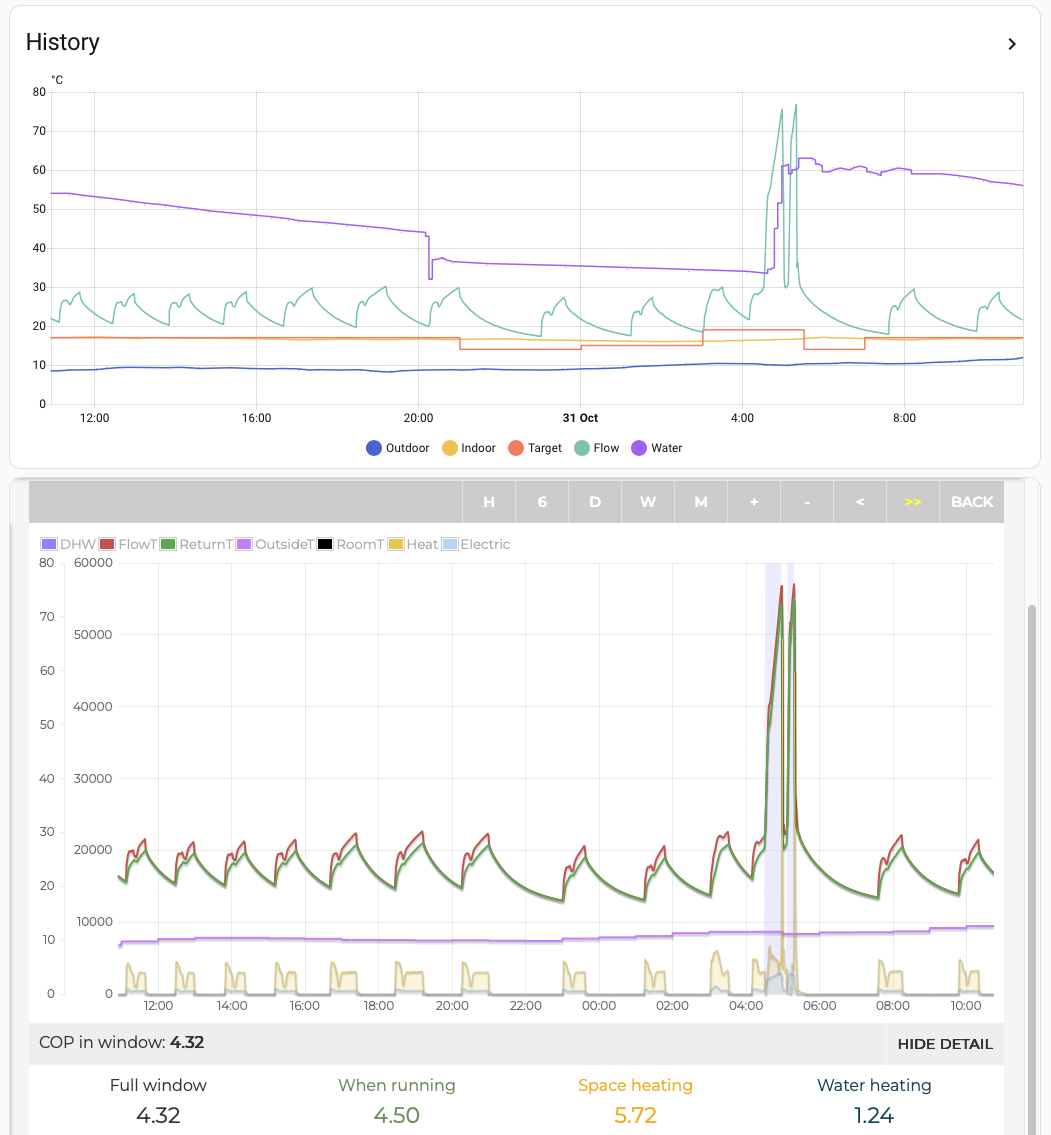
You can’t beat the Emoncms web view for a detailed look at the data. So, I didn’t try. I just pull it into my detailed dashboard using a web card. There’s also a history graph for the temperature sensors.
The default web view isn’t that useful, showing a histogram over the full set of recorded data. It does support a limited set of URL parameters which aren’t well documented. I had to poke around in the source code to find them all. If you add &hours=24&mode=power to the end of the standard URL, you get a more useful starting point. There are also start and end parameters which take timestamps for exact control of the timeline to display.
Weather Dashboard
Now that I have access to more detailed and accurate weather it would be a shame if I didn’t make more use of it. I have the standard Home Assistant weather card on my dashboard but it’s pretty limited in what it can do. I found this article helpful when navigating the landscape of custom Home Assistant weather cards.
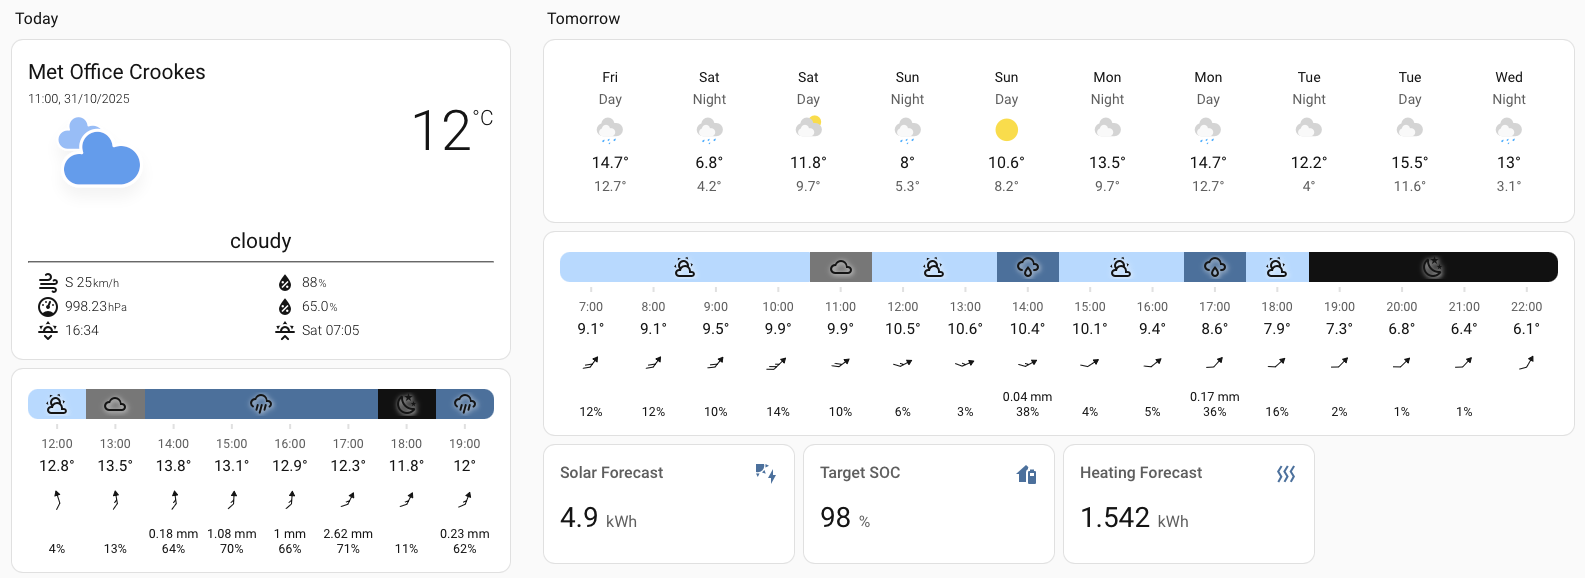
I started with the Platinum weather card, shown top left. It looks good on paper. An overview area, configurable slots to display a huge variety of different weather attributes, an area for daily summaries. Unfortunately, only a subset of the attributes provided by the Met Office weather were picked up. I couldn’t get daily forecast slots to work at all.
On further inspection, I realized that there haven’t been any updates in 3 years. That predates significant changes in Home Assistant 2023.9 for how detailed forecast data is accessed. I’m using it to display an overview, the actual outdoor temperature from myVAILLANT, sunrise and sunset, and the few Met Office attributes that it does support.
There is a fork which hacks in support for the new weather system. However, I’m not interested now that I’ve found the Hourly weather card. This thing is brilliant. I use it in the “Today” section to provide an overview for the next few hours. It pulls in min/max temperatures, wind direction and speed, precipitation probability and amount.
There’s a sprinkling of templating support for defining which hours to show. I’ve used it in the “Tomorrow” section to show forecasts from 7.00 to 22.00 on the day after today. The documentation explains the common use cases very clearly.
I use the standard weather card to provide an overview of the next few days weather, then throw in my solar and heating forecasts too.