Summer time, and the living is easy. My heat pump and Heat Geek NanoStore hot water system were installed last October. So far, I’ve shown you performance data from the winter months. How does the system behave when the heating is turned off?
Temperature Sensor
Last time, I left you with a cliff hanger. I found that the tank temperature sensor was providing erratic readings.
The sensor was replaced on May 15th. I also got them to move the sensor up near the middle of the tank. The previous position, near the cold water inlet at the bottom of the tank, is meant to respond quickly when hot water is drawn off. The idea is to use that temperature drop to start the heat pump and replace the stored heat being drawn off. However, it never responded quickly enough for the heat pump to ramp up in time before the stored hot water ran out.
At the same time, the sensor position had the downside in winter that it would eventually report values lower than 10°C. That triggers the heat pump to run a frost protection cycle. Which is pointless as the the top of the store still has plenty of hot water.
As we can’t rely on the sensor to respond quickly enough, we boost the hot water before using the shower. It makes more sense to put the sensor where it will more accurately report the remaining hot water temperature.
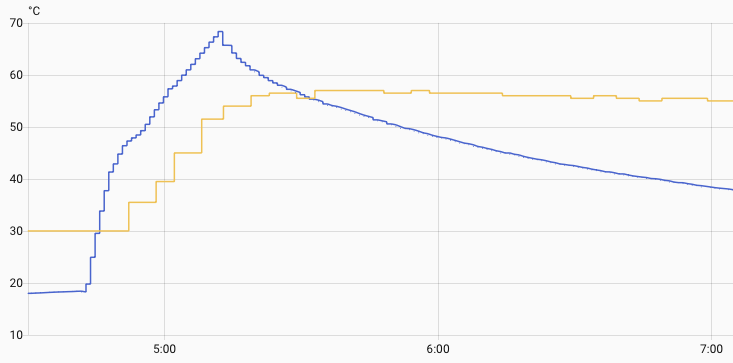
Here’s an overnight DHW run. We have a sensible looking tank temperature curve in orange. It’s coarse grained because Vaillant cloud only updates values every 5 minutes. The flow temperature from Open Energy Monitoring (updates every 10 seconds) is shown in blue.
Once the DHW run ends, tank temperature equalizes and then stays stable, declining gently. I still use Home Assistant to stop the DHW run when return temperature hits 65°C. It will continue to prevent temperature ramping up too high if the sensor goes on the blink again in the future.
DHW
What’s the effect of summer temperatures on DHW runs? This is a run from May 16th, after the temperature sensor was replaced. It’s a cold night, 5°C outside, and the heating is on.
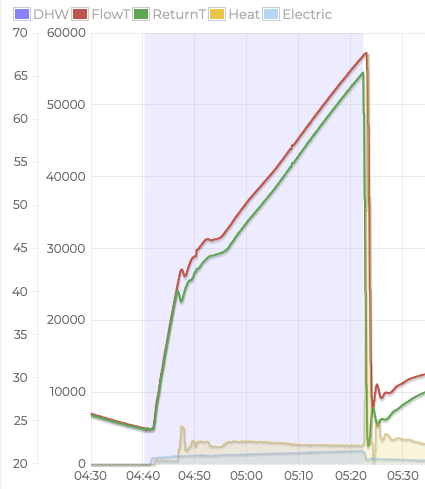
We added 1.772kWh heat, using 1.019kWh electric for a COP of 1.74. As the heating is on, the remaining hot water in the pipes is dumped into the heating circuit at the end of the run. That results in a big spike of heat with the graph’s Y-axis going up to 60kW.
Compare that to a run from September 2nd. Its 14°C outside and the heating is off.
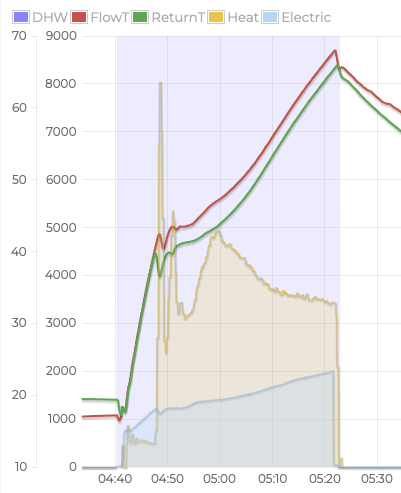
We added 2.285kWh of heat, using 0.982kWh electric for a COP of 2.33. There’s a significant improvement in efficiency when it’s warmer outside.
The heating is off, so there’s no heating circuit pump running when the DHW run ends. The remaining hot water sits in the pipes and heat slowly dissipates, mainly via convection/conduction along the pipes. There’s no big spike of heat, with the graph’s Y-axis going up to 9kW.
Shower
As a reminder, here’s what happens when showering in winter.
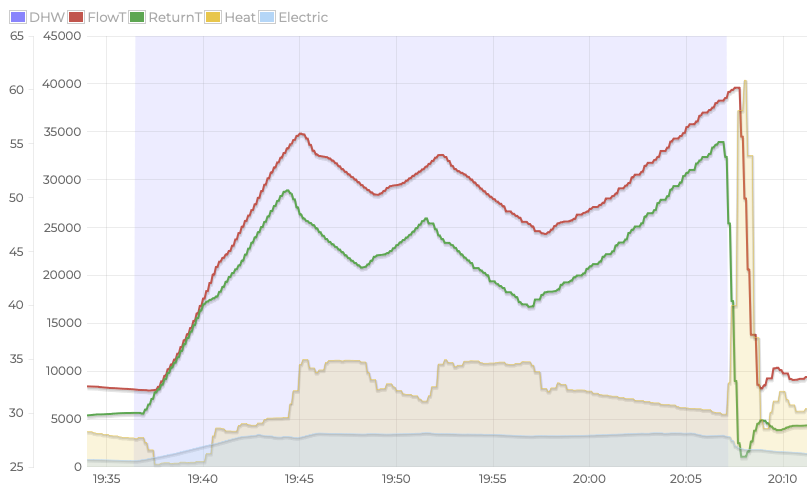
This is two back to back showers. It takes about 10 minutes after pressing boost for flow temperature to hit 55°C. If you run the shower at its full 8L/min flow rate, you take heat out of the store faster than the heat pump can replenish. The flow temperature drops rapidly. After 8 minutes of showering you’ll notice the water temperature at the shower head start to drop.
When the first shower ends, it takes five minutes to get back up to temperature for the next shower. In contrast, here’s what a 25 minute shower looks like on July 21st, when it’s 20°C outside.
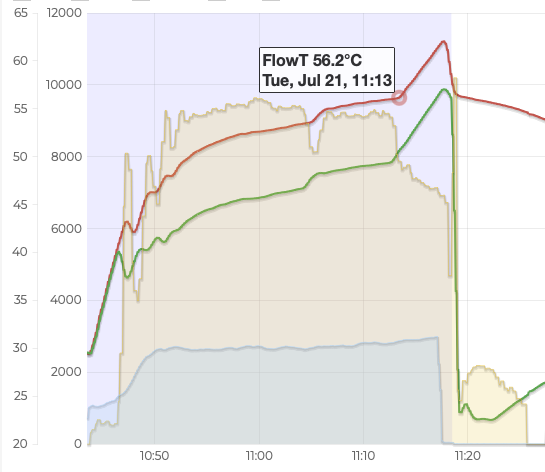
The flow temperature keeps going up while showering. The heat pump is providing more heat than needed. You can shower indefinitely with full flow.
At the end of the run, flow temperature gently declines in the same way as the summer time DHW run. However, return temperature plummets. The heat left in the pipes is clearly going somewhere fast.
The towel rail in our top floor bathroom gets noticeably warmer, none of the other radiators do. There must be some sort of convection current that gets going around the heating circuit. I’ve no idea why it doesn’t always happen.
Home Assistant
I had to make a couple of changes to my Home Assistant setup.
Heating Forecast
I use the next day’s weather forecast to predict how much heating we’ll need each hour. That in turn is used to decide how much charge to add to our home battery overnight. We want to leave some room to capture any excess solar generation.
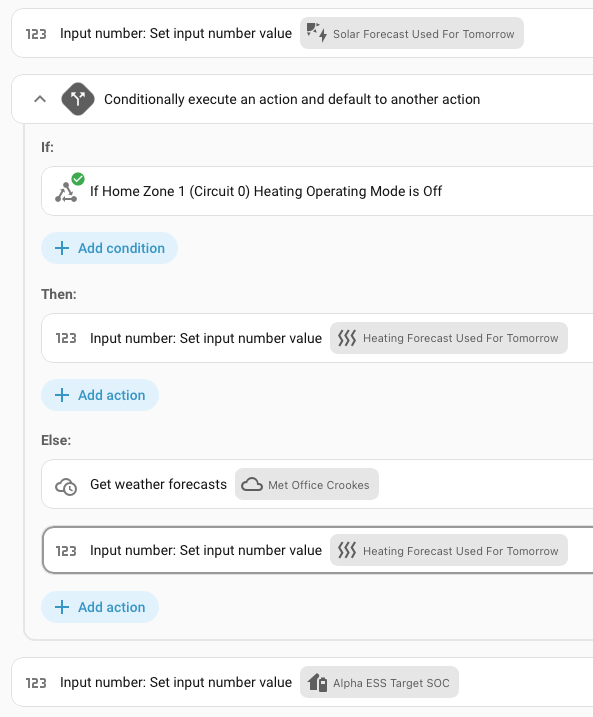
If the heating is off, we won’t generate any heat. I can skip the forecast and set the heating estimate to 0.
Self Sufficient
In the winter, we always needed to add some charge to the battery overnight. However, in summer the remaining charge in the battery is frequently above the target. During the peak summer months, there are often days when we can be completely self-sufficient, with solar generation exceeding our consumption.
Our home battery won’t discharge during a charging period. During this time we use power from the grid. The behavior makes sense for most cases. You charge overnight on low price electricity. There’s no point using battery power when you can use the low price electricity directly.
My solar panels were installed via a government incentive program that pays us for the electricity they generate, regardless of how the power is used. We don’t get anything extra for exporting it. In my case, it makes more sense to discharge the battery in the night if we can refill it using solar generation the next day.
I updated my Home Assistant battery management automation to discharge during the night while we’re above the target SOC. The automation uses the composite automation pattern. I have a list of triggers and then a choose action to run code appropriate for each trigger.
I added a couple more triggers for the start of the normal overnight charging period and for when battery SOC falls below target.
triggers:
  - trigger: time
    at: '23:25:00'
    id: night_start_time
  - trigger: numeric_state
    entity_id:
      - sensor.al5002122110369_instantaneous_battery_soc
    below: input_number.alpha_ess_target_soc
    id: soc_below_target
If actual SOC is above target at the start of the charging period, I turn charging off. Once the actual SOC falls to the target SOC, I turn charging back on.
actions:
  - choose:
      - conditions:
          - condition: trigger
            id:
              - night_start_time
          - condition: numeric_state
            entity_id: sensor.al5002122110369_instantaneous_battery_soc
            above: input_number.alpha_ess_target_soc
        sequence:
          - action: input_text.set_value
            data:
              value: '00:00'
            target:
              entity_id: input_text.alpha_night_charge_time_start
          - action: input_text.set_value
            data:
              value: '00:00'
            target:
              entity_id: input_text.alpha_night_charge_time_end
      - conditions:
          - condition: trigger
            id:
              - soc_below_target
        sequence:
          - action: input_text.set_value
            data:
              value: '23:30'
            target:
              entity_id: input_text.alpha_night_charge_time_start
          - action: input_text.set_value
            data:
              value: '05:30'
            target:
              entity_id: input_text.alpha_night_charge_time_end
The battery API updates all the settings at once, even if you only want to change a subset of them. Previously, each path in the automation had its own action to call the battery API, with sometimes complex logic to work out the appropriate values for the settings I didn’t want to change.
I refactored the automation so that I update helper entities for the desired state of each battery setting. I can change just the subset of settings needed. I have a single common action at the end of the automation that applies the current value of all the settings.
  - action: alphaess.setbatterycharge
    metadata: {}
    data:
      enabled: true
      cp1start: '{{ states(''input_text.alpha_night_charge_time_start'') }}'
      cp1end: '{{ states(''input_text.alpha_night_charge_time_end'') }}'
      cp2start: '{{ states(''input_text.alpha_day_charge_time_start'') }}'
      cp2end: '{{ states(''input_text.alpha_day_charge_time_end'') }}'
      chargestopsoc: '{{ states(''input_number.alpha_ess_target_soc'') }}'
SCOP
I have almost a full year’s worth of data in Open Energy Monitoring. My combined SCOP (heating and hot water) is 3.57 since installation. Which is a bit disappointing given the Heat Geek guarantee of 3.8. However, that guarantee is based on the original design using a 110L MiniStore for hot water, rather than the experimental 60L NanoStore we ended up with.
If I look at heating performance only, the SCOP is 4.14. The DHW performance is pulling the overall efficiency down. Looking at each season in turn we have:
- Winter (Dec-Feb): COP 3.5, Heating 3.8, DHW 2.75
- Spring (Mar-May): COP 3.8, Heating 4.45, DHW 2.93
- Summer (Jun-Aug): COP 2.58, No Heating, DHW 2.58
Which is better DHW performance than I was expecting. The overnight runs get 2.33 at best. The NanoStore is a big heat exchanger and works most efficiently when used as a heat exchanger. That’s during a shower, when the system is running in “combi” mode. At full power we use 3kW of electricity to generate 10-11kW of heat. That’s an instantaneous COP of 3.5.
The more showers we take, the higher the efficiency.
Cost
The usual rule of thumb is that you need a SCOP of 3.5 to break even compared with gas. Does my low summer COP mean I’m losing money? Let’s have a look.
Prices in the table are in £ sterling with data from my energy supplier, Octopus (online dashboard + bills).
| Month | Old Gas | New Gas | Old Elec | New Elec | Old Total | New Total | Reduction |
|---|---|---|---|---|---|---|---|
| November | 85.12 | 11.26 | 40.47 | 92.22 | 125.59 | 103.34 | 18% |
| December | 101.96 | 11.42 | 43.00 | 111.43 | 144.96 | 122.85 | 15% |
| January | 134.25 | 11.88 | 44.08 | 138.02 | 178.33 | 149.90 | 16% |
| February | 108.09 | 10.31 | 37.32 | 101.27 | 145.41 | 111.58 | 23% |
| March | 79.18 | 11.32 | 36.67 | 62.03 | 115.85 | 73.35 | 37% |
| April | 55.65 | 9.18 | 24.17 | 39.95 | 79.82 | 49.13 | 38% |
| May | 30.35 | 9.90 | 28.17 | 46.83 | 58.52 | 56.73 | 3% |
| June | 22.40 | 9.57 | 27.40 | 29.94 | 49.80 | 39.51 | 21% |
| July | 18.09 | 9.70 | 31.13 | 35.76 | 49.22 | 45.46 | 8% |
| August | 19.86 | 10.03 | 37.50 | 36.55 | 57.36 | 46.58 | 19% |
We saved money each month compared with the previous year’s gas bill. However, it got close, with only small savings in May and July.
Energy Consumption
We can remove one variable by looking at energy consumption in kWh rather than cost.
| Month | Old Gas | New Gas | Old Elec | New Elec | Old Total | New Total | Reduction |
|---|---|---|---|---|---|---|---|
| November | 1227 | 21 | 273 | 672 | 1500 | 693 | 54% |
| December | 1493 | 18 | 291 | 809 | 1784 | 827 | 54% |
| January | 1981 | 24 | 311 | 1011 | 2292 | 1035 | 55% |
| February | 1581 | 14 | 240 | 651 | 1821 | 665 | 63% |
| March | 1109 | 14 | 210 | 455 | 1319 | 469 | 64% |
| April | 664 | 8 | 78 | 370 | 742 | 378 | 49% |
| May | 296 | 16 | 131 | 354 | 427 | 370 | 13% |
| June | 186 | 15 | 125 | 125 | 311 | 140 | 55% |
| July | 145 | 10 | 176 | 207 | 321 | 217 | 32% |
| August | 173 | 14 | 263 | 216 | 436 | 230 | 47% |
Now you can see a more consistent reduction in energy use. However, May is still a significant outlier.
Energy Breakdown
Let’s break down energy usage further so we can compare apples to apples. For electricity, I’m using data from Home Assistant which doesn’t exactly match the Octopus figures due to different ways of measuring and accounting periods not being perfectly aligned.
I used Old Gas - New Gas from the table above as a best guess estimate for gas used for heating (everything apart from cooking).
| Month | Old Heat Gas | Grid Import | Solar Generated | Heat Pump | EV Charging | Other | Unit Price | Heat Ratio |
|---|---|---|---|---|---|---|---|---|
| November | 1206 | 677 | 55 | 338 | 119 | 267 | ≈10p | 3.57 |
| December | 1475 | 782 | 30 | 445 | 116 | 242 | ≈12p | 3.31 |
| January | 1957 | 1030 | 39 | 591 | 216 | 253 | 11.4p | 3.31 |
| February | 1567 | 663 | 38 | 428 | 42 | 225 | 12.3p | 3.66 |
| March | 1095 | 482 | 140 | 323 | 62 | 223 | 7.9p | 3.39 |
| April | 656 | 385 | 206 | 217 | 178 | 169 | 5.2p | 3.02 |
| May | 280 | 358 | 198 | 144 | 269 | 119 | 5.0p | 1.94 |
| June | 171 | 126 | 192 | 59 | 68 | 176 | 3.6p | 2.89 |
| July | 135 | 195 | 226 | 47 | 182 | 164 | 3.9p | 2.87 |
| August | 159 | 219 | 188 | 52 | 166 | 183 | 4.3p | 3.06 |
We’ve switched our heating and hot water from gas to the heat pump. I calculated a heat ratio from Old Heat Gas / Heat Pump to see how much energy we’ve saved. You can immediately see that there’s a massive reduction. Reassuringly, the heat ratios are pretty close to the measured seasonal COP.
Most of the low reduction in energy usage for May is down to the amount of EV charging we did. There was a lot of travel that month. However, it doesn’t explain everything. The heat ratio for May (which excludes the effect of EV charging) is still low.
My best guess is a difference in the weather. May 2025 was a record warmth month for the UK with high pressure dominating, so significantly less heating demand than May 2026. Our gas use more than halved for May 2025 compared with April 2025, there was nowhere near that drop this year.
The break even ratio of 3.5 is based on the difference between gas and electricity prices when using a standard “price cap” tariff. Fortunately, I’m on a smart electricity tariff paying 7p a kWh off-peak, 28p a kWh at peak times. Gas is 7p a kWh at all times.
Even more fortunately, I have a battery and solar panels. I can switch some of my peak time consumption to off-peak prices using the battery. Any solar I consume is free. I’ve calculated an average unit electricity price for each month using Home Assistant data that tracks my peak and off-peak grid import separately. I only have this data for January onwards, so figures for November and December are estimated.
In the winter months my battery runs out before the end of the day, requiring some consumption of peak rate electricity. Average unit price is still well below break-even level compared with gas.
In the summer months I use effectively zero peak rate electricity which combined with high solar generation results in an average unit price significantly less than gas. This more than offsets the lower efficiency DHW only summer COP.
Conclusion
The heat pump and NanoStore are still working well. As expected, water heating via the NanoStore is not as efficient as using a hot water cylinder. I was surprised that it makes such an impact on the overall efficiency for heating and hot water combined. This is especially noticeable in the summer when the heating is off.
I’m still saving money compared with the old gas boiler, thanks to my home battery and solar panels. They’re incredibly good at keeping the effective per unit rate of electricity down, especially in summer.