We had a cold snap here in the UK. Over a few days, temperatures dropped from consistently over 10°C, to days at or below freezing. Perfect weather for dialing in a heat pump.
Weather Compensation
Heat pumps run best using weather compensation. The amount of heat lost by a house is proportional to the difference in temperature between the outside and inside. Weather compensation uses an external sensor to measure the outside temperature and determine the amount of heat required to match the heat lost.
We have a Vaillant Arotherm plus heat pump. Vaillant heat pumps use a constant flow rate around the heating circuit. They vary the flow temperature of the water to adjust the heat output. A heat curve parameter is used to map between targetTemperature - outsideTemperature and desired flowTemperature. The larger the heat curve parameter, the higher the flow temperature and the higher the heat output.
The initial heat curve setting is calculated based on your expected heat loss. We have an expected heat loss of 6kW at -3°C outside and 17°C inside. That’s equivalent to 300W per degree difference. The corresponding heat curve setting is 0.7.
The expected heat loss is an estimate. You typically need to nudge the curve up or down depending on how close the estimate is to the actual heat loss. This process works best in cold weather when other heat sources (solar gain, occupancy, cooking) are less significant.
The usual rule of thumb is to keep reducing the heat curve every few days, one step at a time, until you’re too cold. Then nudge it back up one step and call it done. Since we’ve had the heat pump installed, I’ve gradually reduced the heat curve down to 0.55, where it’s been for a while.
In theory you can run the heating system entirely on weather compensation, ignoring the temperature reading from the sensoCOMFORT thermostat. Vaillant calls this “Inactive” mode and is how our system was commissioned.
During the day we have a target temperature of 17°C. The other members of the household are cold-blooded and start complaining of being too hot if the temperature goes over 18°C. I start to feel properly cold below 16°C. There’s a two degree comfortable range that I’m aiming for.
Reference Data
I’ve collected a set of hopefully useful data each day during the cold weather.
| Day | Outdoor °C | Indoor °C | Solar kWh | DHW mins | Daily COP | Insta COP | Power W | Runs |
|---|---|---|---|---|---|---|---|---|
| 12 | 11.3➤12.5 | 16.7➤16.9 | 0.1 | 100 | 5.53 | 6.0 | 550 | 20% |
| 13 | 10.2➤11.9➤8.1 | 16.3➤17.6➤17.3 | 2.1 | 34 | 5.2 | 5.7➤5.9➤5.3 | 550 | 20% |
| 14 | 7.7➤6.0 | 17.2➤16.7 | 0 | 43 | 4.89 | 5.0 | 600 | 50% |
| 15↑ | 6.5➤8.2➤7.5 | 16.5➤16.9 | 0 | 46 | 5.35 | 5.2➤5.4➤5.3 | 580 | 50% |
| 16↓ | 6➤6.3➤4.2 | 16.8➤17.5➤17.3 | 0.8 | 22 | 4.42 | 4.6➤4.4 | 630 | 66% |
| 17* | 1.7➤4.2➤0.6 | 16.7➤18➤16.9 | 5 | 48 | 3.99 | 4.0➤4.4➤4.1 | 630 | 80% |
| 18↑↑ | 1➤5.2➤3.9 | 15.9➤15.3➤15.9 | 1.3 | 26 | 4.45 | 4.3➤4.9➤4.5 | 630 | 75% |
| 19* | 0.7➤1.2➤-1.1 | 16.3➤17.1➤16.1 | 1.95 | 86 | 3.72 | 4.0➤4.1➤3.7 | 700➤900 | 100% |
| 20* | -1➤1.5➤0.3 | 16.2➤17.5➤16.9 | 4.19 | 0 | 3.93 | 3.6➤4.2➤4.0 | 900➤650 ➤750 | 100% |
| 21* | -0.5➤2.8➤1.3 | 16.5➤18➤16.9 | 4.32 | 0 | 3.9 | 3.9➤4.2➤4.1 | 850➤650 | 90% |
| 22 | 2.5➤5.7➤4.3 | 15.8➤15.3➤16.5 | 0.45 | 78 | 4.31 | 4.4➤4.2➤4.5 | 650 | 90% |
The table is densely packed, so I have some explaining to do. Each day covers the peak time hours when heating is active with a target temperature of 17°C (6am to 9pm). There’s a setback temperature of 15°C after 9pm to help promote sleep. The target temperature drives up during cheap off-peak hours to try and be back at 17°C for the start of the next day.
Days are dates in November 2025. Each day is annotated with significant events. Up (↑) and down (↓) arrows show when I nudged the heating curve up or down one step. Asterisks (*) show when the heat pump defrosted during the day (see more on that below).
Each column can have one, two or three values. There’s one entry if the value is a summary for the entire day, or is a continuous changing value that was pretty much constant through the day. Two values describe a roughly linear change starting at 6am with the first value, ending at 9pm with the second value. Three entries describe a curve between 6am and 9pm with the middle value being the maximum or minimum value during the day, depending on the shape of the curve.
The Outdoor temperature is from the Vaillant sensoCOMFORT external sensor used for weather compensation. Indoor temperature is from the sensoCOMFORT thermostat in the hall. If all’s going well it should be 16 - 18°C.
Solar is energy produced by our solar panels. I’m using it as a crude proxy for the effect of solar gain. At this time of year, anything over 4kWh is a really sunny day.
DHW is the number of minutes that the DHW circuit is active, and hence the heating is off. Daily COP is the overall COP during peak hours. Insta COP is instantaneous COP reported by Open Energy Monitoring, once the heat pump has settled into a steady state during each heating cycle.
Power is the instantaneous electrical power used by the heat pump. Runs is the percentage of the time that the heat pump is running. The heat pump has a minimum power level around 500-600W. If that produces too much heat, the heat pump has to cycle on and off.
Pointless Heating Cycles
I was surprised how low the outside temperature has to get before the heat pump runs continuously. There was always some cycling unless the temperature stayed consistently below 2°C.
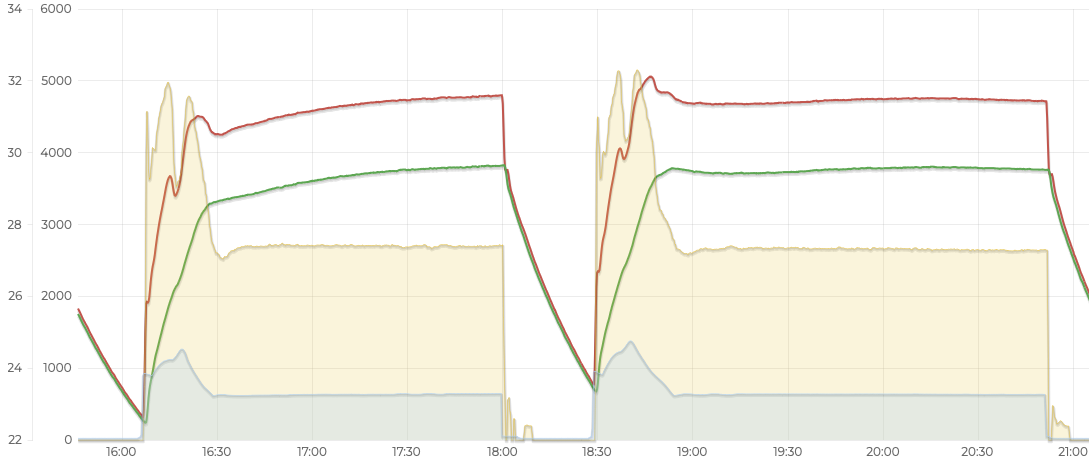
This is late in the day on Nov 17th. It’s 1°C outside, 17.1°C inside. The heat curve is 0.55 with a corresponding target flow temperature around 29°C. I thought it would finally be cold enough for the heat pump to run continuously at minimum power. This is as close as it got. COP is 4.1.
When the heat pump starts up, it always has a power profile where it ramps up beyond the power it needs long term and then throttles back. This is normal behavior, just part of the startup sequence needed to get the heat pump running properly. In this case, it adds just enough additional heat to tip the energy integral over the edge and make the heat pump cycle.
It’s a catch 22 situation. If the heat pump ran continuously at minimum power there would be no need to cycle. However, the heat pump is cycling, so it can’t run continuously at minimum power.
This is from Nov 20th. It’s 1.5°C outside, 17.6°C inside. I’ve turned the heat curve up to 0.65 with a corresponding target flow temperature of 32°C. The heat pump ran continuously all day, at minimum power around midday. COP was also 4.1 despite the higher target flow temperature.
On Nov 21st we’re cycling again. It’s 2°C outside, which drops the target flow temperature to 31.5°C, just below what can be sustained at minimum power.
Heating Forecast
I use Home Assistant to predict the next day’s peak time heating load so that I know how much charge to add to my home battery overnight. I don’t want to charge to 100%, then find that it’s a mild and sunny day and there’s nowhere to put the excess solar I’ve generated.
The initial implementation was based on limited performance data. At the time, outdoor temperature hadn’t gone below 10°C and I was consistently seeing a COP around 5. My installation has a minimum performance guarantee of 380% efficiency, whatever that means. Given the lack of better data, my forecast used a linear interpolation between a COP of 5 at 10°C and a COP of 3.8 at -3°C.
Now I have much better data. First, it looks like it’s reasonable to assume a COP of 5 for temperatures above 6°C. After that it gets complicated and non-linear. However, it doesn’t much matter. The point of the forecast is to determine how much to charge the battery. With temperatures below 6°C, the battery will end up being charged to 100% anyway.
I’d still like to get the prediction somewhat close, with minimal effort, so will do a linear interpolation again from COP 5 at 6°C down to COP 4 at 0°C, then extrapolating after that.
{% set forecasts = forecast['weather.met_office_crookes'].forecast | list %}
{% set start = today_at('06:00') + timedelta(days=1) %}
{% set end = today_at('21:00') + timedelta(days=1) %}
{% set ns = namespace(sum=0.0) %}
{% for slot in forecasts %}
  {% set dt = slot.datetime | as_datetime %}
  {% set t = slot.temperature | float %}
  {% if dt >= start and dt < end and t < 14 %}
    {% set cop = 5.0 %}
    {% if t < 6 %}
      {% set cop = 5.0 - (6 - t) * 0.1666 %}
    {% endif %}
    {% set ns.sum = ns.sum + (14 - t) * 0.291 / cop %}
  {% endif %}
{% endfor %}
{{ ns.sum | round(3) }}
Defrosts
In cold weather, ice can build up on the back of the heat pump, which reduces performance. The heat pump will defrost itself when needed by reversing operation. It temporarily moves heat from inside the house to heat up the back of the heat pump and melt the ice.
The heat pump uses its own temperature and pressure sensors to determine when a defrost is needed. The impact of ice built up is also visible in reduced performance.
I saw my first defrost cycle on Nov 17 when the temperature was below 4°C all day. On cold days there were usually one or two defrosts during the day, with more overnight. At the coldest point, on the morning of Nov 19, there were three defrosts, one every two hours.
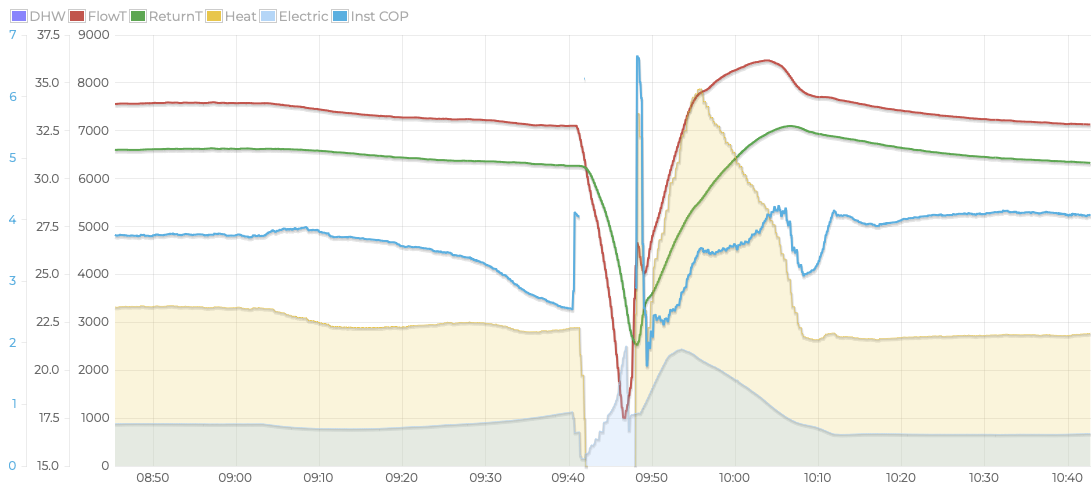
This is a defrost cycle from Nov 21 with an outdoor temperature at 0°C. Defrosts are easily recognized in Open Energy Monitoring from the V shaped flow temperature curve. The telltale sign is that the flow temperature drops to below the return temperature as heat is removed.
The blue line on the graph is instantaneous COP. In the hours leading up to the defrost cycle, COP was a steady 3.8. Over a period of 30 minutes, COP falls off a cliff, down to 2.5 when the defrost cycle starts. Once the defrost is over and the heat pump has settled down, COP goes up to 4.1.
When the heating cycle restarts after defrost, there seems to be an extra large ramp up before throttling back. This results in a noticeably higher starting flow temperature which in turn can trigger cycling.
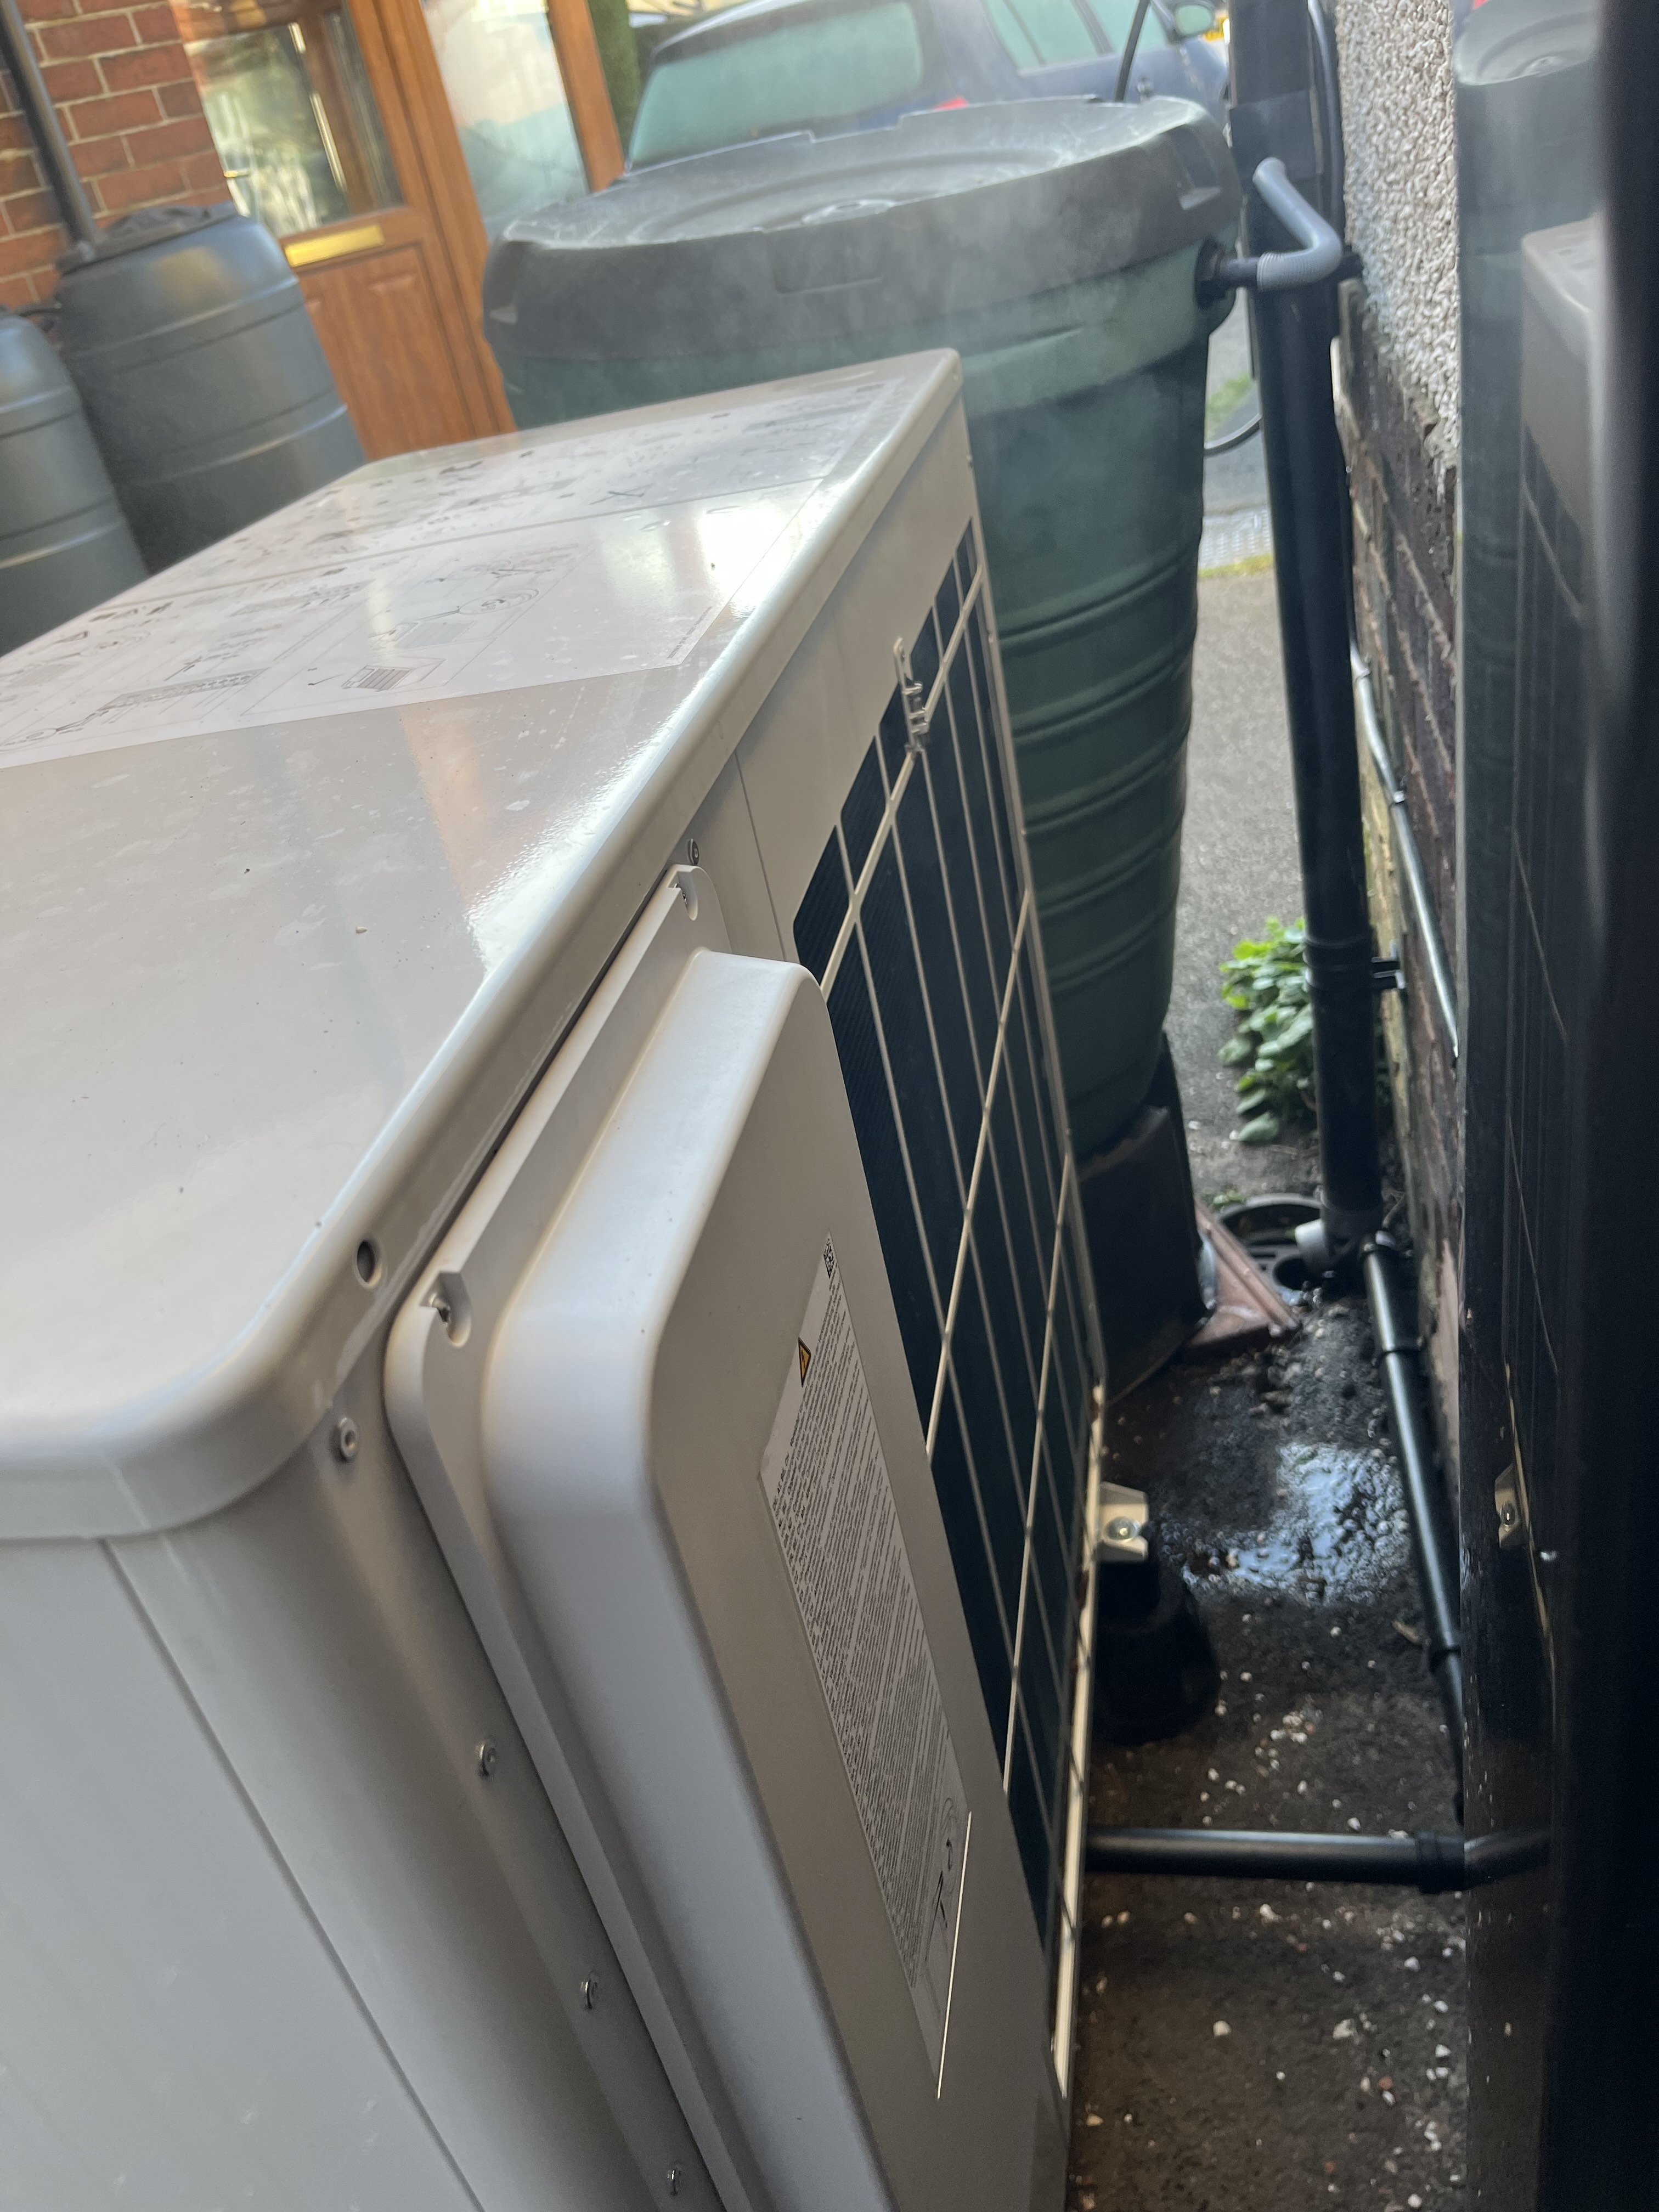
I captured this dramatic image at just the wrong moment. When I arrived the black panel on the back of the heat pump was white with a thin layer of frost. It disappeared seemingly all at once into clouds of steam (barely visible in the photo).
I missed the most dramatic moment. When the heat pump goes back to normal operation, one last big cloud of steam is blown out of the front, which is fun if you’re standing there at the time.
All that steam results in more than the usual level of condensate. This is the first time I’ve seen water on the ground. Fortunately, there’s a natural slope under the heat pump leading to the drain. There’s no freezing hazard in front of the heat pump.
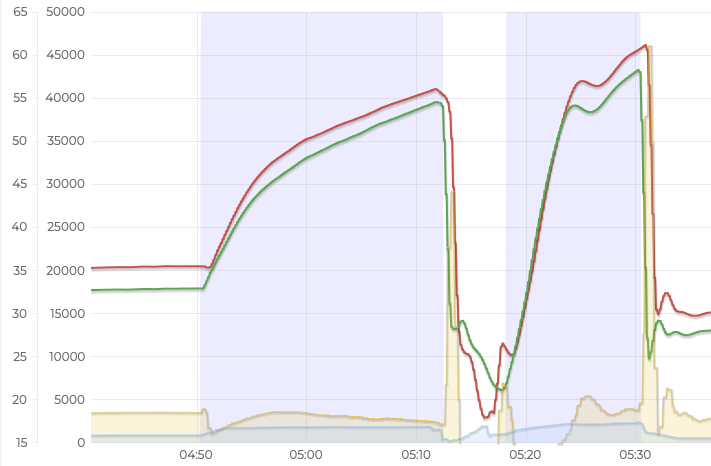
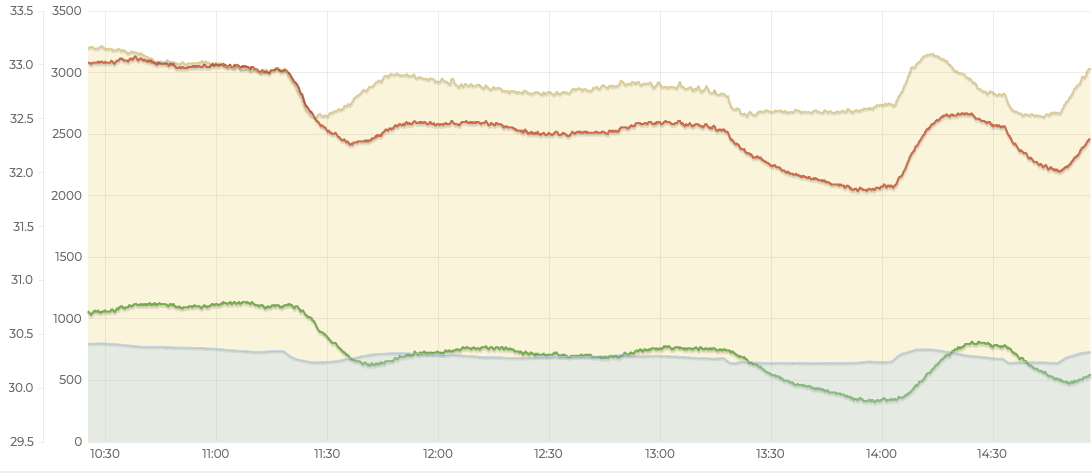
There’s a regular DHW (domestic hot water) run lasting from 4.50 to 5.30, catching the last of the cheap electricity rate. During this run, a defrost cycle starts at 5.12 and lasts until 5.18. Again, you can see the characteristic V shape with return temperature above flow temperature.
My 40 minute timed DHW period isn’t long enough to fully heat the water if there’s a defrost. The target is 62°C, the actual temperature achieved peaked at 50.5°C.
During the initial DHW cycle, notice that the heat pump doesn’t ramp the power up, meanwhile heat output is dropping all the time. Definitely time for a defrost.
The most interesting thing is that the heat pump switches to the heating circuit before running the defrost. This avoids taking the heat from your hot water tank. Chatter on the forums suggests that this is expected, Vaillant Arotherms always take heat from the heating circuit.
It’s important that it works this way if you’re using a MiniStore/NanoStore hot water system. These are usually installed with a diverter valve that returns water directly to the heat pump if flow temperature is below 45°C. That means there wouldn’t be enough water volume for effective defrosting if the DHW circuit remained active.
Heat for defrosting is taken from the heating circuit inside the house. There needs to be enough volume of water that heat can be extracted without the return temperature falling below 13°C. The Arotherm Plus 7kw requires a minimum of 40L volume.
There’s nothing in the Vaillant docs that explicitly says defrosts always use the heating circuit. However, descriptions of failure codes relating to defrosts always reference the heating circuit.
Hypervolt Charger Current Limit
Our Hypervolt EV charger includes an automatic load management (ALM) system. It limits overall current coming from the grid by throttling down the charger when needed. The three documented settings are 60A, 80A and 100A. My supply fuse is 80A. I don’t know what the installer had set mine to.
I finally get to see it in action. On the evening of Nov 19 I plugged the car in to charge overnight and Octopus scheduled an immediate charge. Our home battery was empty after running the heat pump continuously all day, so that started charging too. One of us was using the shower, so the heat pump was running flat out. Another was cooking, adding another 2kW to the overall demand.
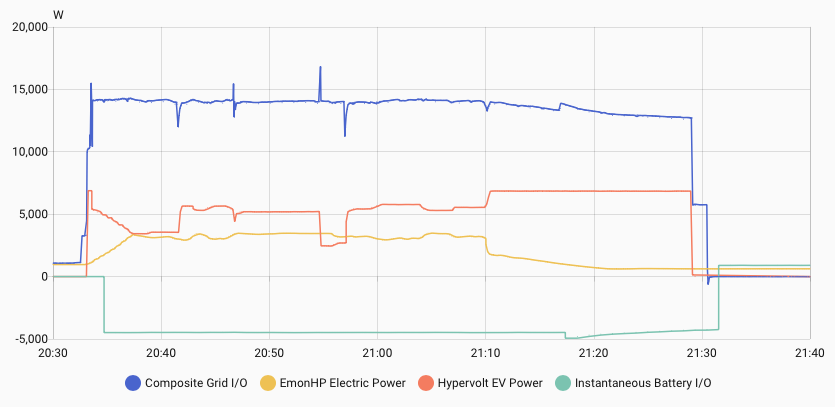
You can see overall import from the grid is capped at about 14kW. The power being drawn by the Hypervolt is mirroring the change in demand from the heat pump. Once the shower ends, the charger hits full power.
The UK nominal grid voltage is 230V with a tolerance of +10% to -6%. An upper limit of 14kW is consistent with an ALM limit of 60A at an actual voltage of 233V.
I’m glad the installer went with the more conservative setting, leaving plenty of head room below the supply fuse limit.
Heating Curve Adjustments
As outdoor temperatures started dropping over the first four days, I noticed indoor temperatures were also trending down. Still in the comfortable range, but below 17°C all day by Nov 15th. I lost my nerve and nudged the heating curve up.
The following day, indoor temperature peaked at 17.5°C. I decided I’d panicked unnecessarily and nudged it back down. The following day, on the back of strong solar gain, we hit 18°C.
Temperatures plunged close to freezing overnight, starting the following day at 15.9°C. The house never recovered, staying below 16°C all day. I nudged the curve up around midday, then again a few hours later after it seemed to have made no difference.
The next three days looked good. Indoor temperatures were always in the 16-18°C range. I thought I’d cracked it. Then on the final day temperatures were in the 15.3-16.5°C range.
Active Mode
I’ve drunk the Kool-Aid and have been running in inactive mode since the heat pump was installed. After all, “it’s the most efficient way of running a heat pump”. It would be a moral failure on my part if I did anything else.
All you need to do is tune the heat curve correctly and you’ll generate the right amount of heat to compensate for your house’s heat loss. If the temperature drops too low for some reason, you lose less heat than expected, and eventually the temperature will naturally increase back to the target. If the temperature goes too high for some reason, you lose more heat than expected, and eventually the temperature will naturally reduce back to the target.
The problem is that there are too many other factors to take into account. Solar gain on sunny days can increase temperature by a couple of degrees. Increased occupancy, lots of cooking, long sessions on the PlayStation all add heat.
On the other hand, the heating is off during DHW runs. With a MiniStore/NanoStore hot water system you have a DHW run every time you take a shower. The amount of time that the heating is off varies day to day. The energy integral calculation is paused during DHW, so nothing compensates for the lost heating. It takes a long time for a perfectly tuned heat curve to recover temperature.
Defrosts actively remove heat. Again, there’s no compensation for what’s been lost. Every day is different, making it hard to determine the “correct” heat curve. And even if you do have the right curve, it takes too long to recover from those external factors. Before temperature reverts to target, something else comes along that sends it off course again.
I lost my fear of active mode after reading Mick Wall’s blog. Active is still primarily driven by weather compensation. It just tweaks the flow temperature by a degree or two if the current temperature is too far from target. It doesn’t cause excessive cycling. It’s the equivalent of me nudging the heat curve up or down to try and compensate for solar gain or a long shower.
I switched to active mode on Nov 23.
| Day | Outdoor °C | Indoor °C | Solar kWh | DHW mins | Daily COP | Insta COP | Power W | Runs |
|---|---|---|---|---|---|---|---|---|
| 24* | 3.1➤6.3➤3.6 | 16.1➤17.0➤16.9 | 0.47 | 0 | 4.28 | 4.4➤4.7➤4.4 | 640 | 60% |
| 25* | 2.3➤5.1➤3.0 | 16.7➤18.0➤16.9 | 4.51 | 54 | 4.22 | 4.1➤4.6➤4.2 | 640 | 70% |
| 26 | 1➤5.5 | 16.9➤17.3➤16.2 | 3.39 | 99 | 4.42 | 4.1➤4.5 | 700➤640 | 80% |
| 27 | 10.4➤12.7➤9.6 | 16.5➤17.0 | 0.65 | 0 | 5.26 | 5.7 | 530 | 30% |
So far I’ve been much happier. No noticeable reduction in efficiency. Temperatures maintained within the comfortable range. The massive solar gain on the 25th was quickly moderated down. No problems caused by the near two hours of DHW time on the 26th. The 27th was a mild dull day with no significant external heat gains or losses. Indoor temperature was within half a degree of target all day.